By Phil Kahler, Tualatin Valley Academy, Hillsboro, OR

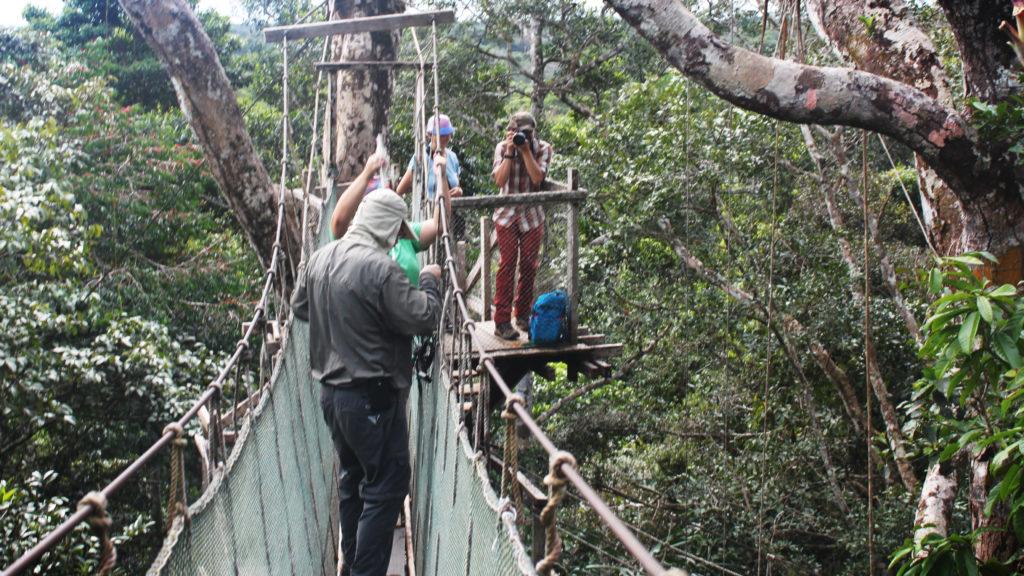
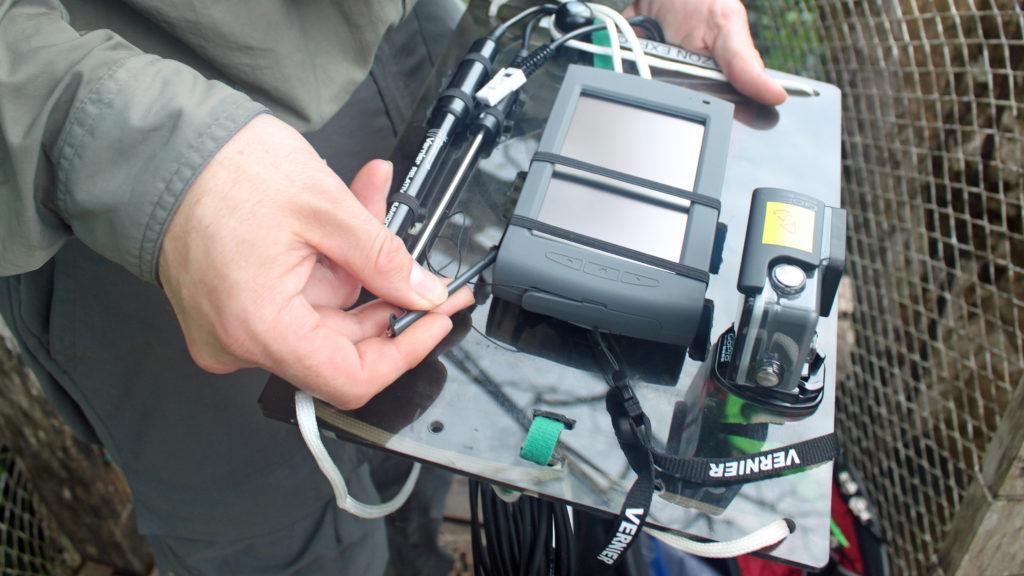
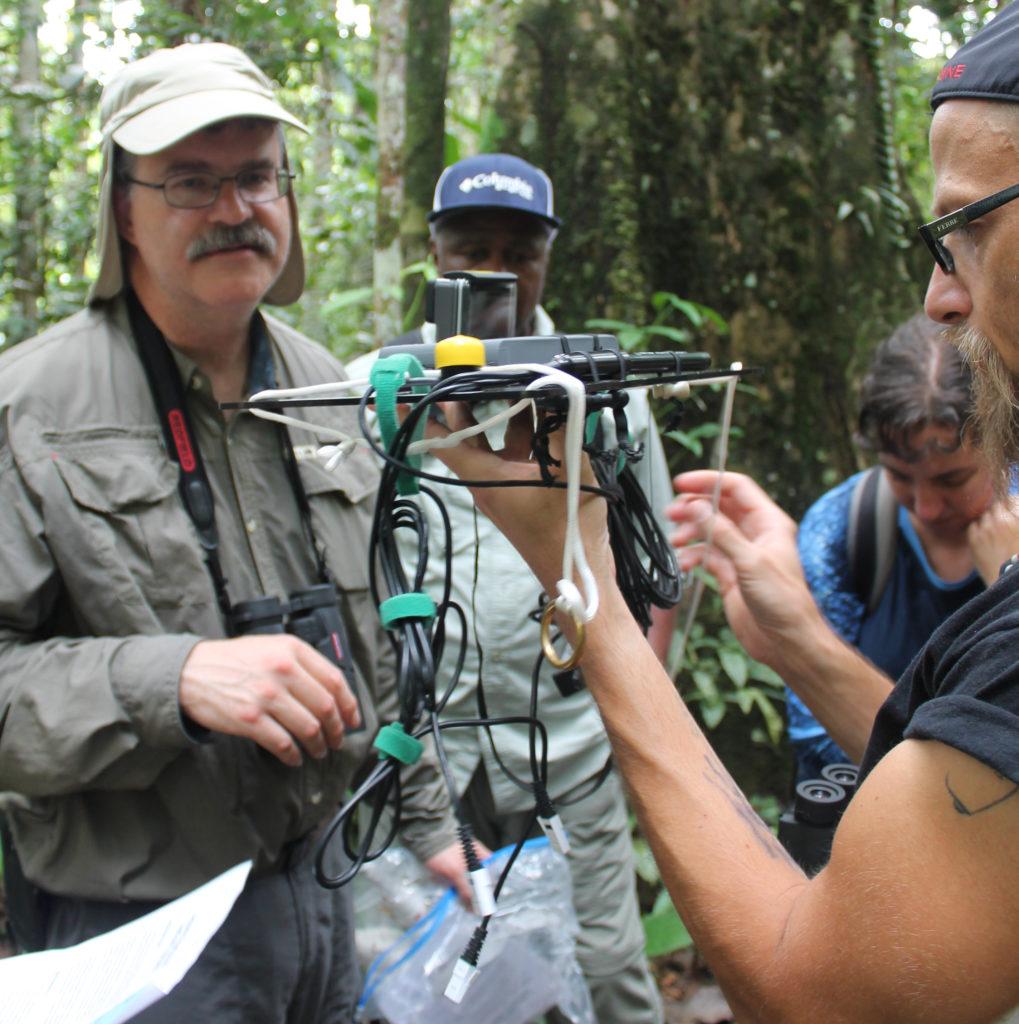
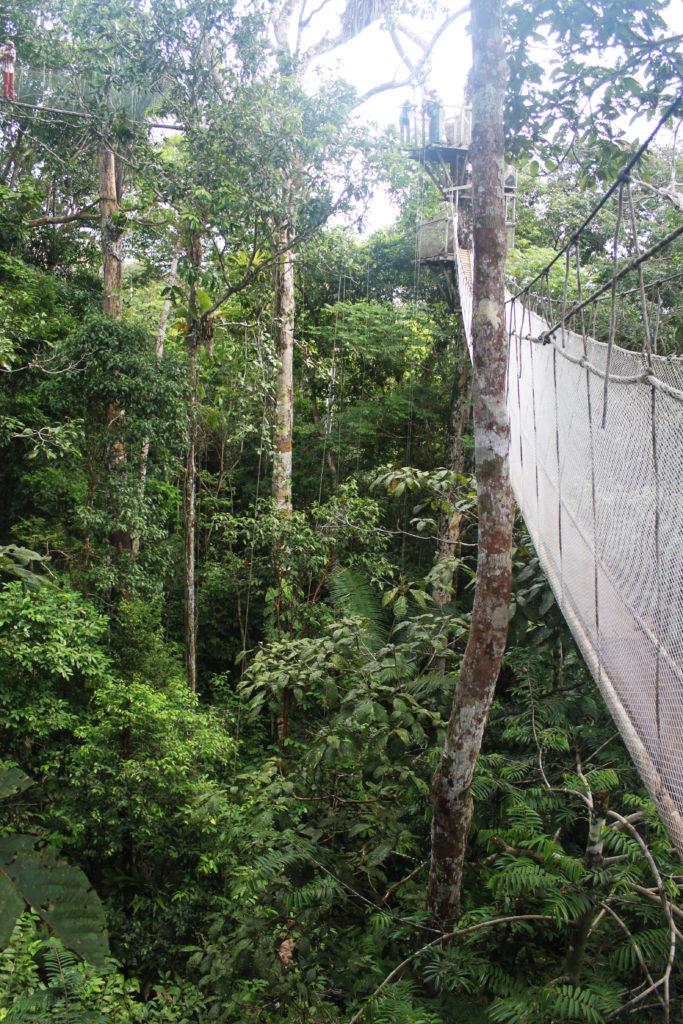
On July 7, 2015, while participating in the Educator Academy in the Amazon Rainforest, I conducted an exciting data-collection study at the Amazon Conservatory of Tropical Studies (ACTS) in Peru to learn how microclimates change at each vertical layer of a tropical rainforest. The initial idea was an ambitious one—lower a LabQuest 2, a Stainless Steel Temperature Probe, a Relative Humidity Sensor, a PAR (Photosynthetically Active Radiation) Sensor, and a GoPro® camera to collect video paired with data for simultaneous visual and graphical analysis from a walkway in the canopy 24 m above the forest floor. We were hoping this would provide a way for students at home to compare temperature, humidity, light, and altitude with the plant and animal life visible in the video.
With the help of Colleen McDaniel from Vernier and my 7th grade students at Tualatin Valley Academy, I devised a procedure for lowering the instrumentation platform. However, what worked well during practice from an unobstructed 5 m balcony turned out to function quite differently in the field. Branches midway through the understory created a tangle of obstacles that prevented a constant rate of descent of the platform and made it difficult to keep the platform level. Our colleagues on the forest floor shouted directions to us, guiding us around problem branches that we could not see. While the video we collected was unusable, the data were useful and interesting.

The data show that the highest temperature and lowest relative humidity values occurred at the rainforest canopy layer. As the LabQuest 2 was lowered through the understory down to the forest floor, the temperature decreased slightly while the relative humidity rose. We also saw a dramatic difference in light levels between the canopy and the understory. As the LabQuest 2 passed through the understory, sudden decreases and increases in illumination were observed. This was likely due to variation in the canopy cover.
Interestingly, PAR and illumination levels were high in the canopy, and as the sensors descend into the understory, PAR and illumination both dropped continuously. The data show that while there is light (measured as illumination), the amount of light available to plants for photosynthesis (PAR) is much lower in the understory than in the canopy. This suggests that there is a lot of competition between plants in the understory for available light.


This project allowed us to see firsthand the relationships between the abiotic and biotic factors that make the Amazon a treasure trove of biodiversity. Armed with photographs, personal stories, and data, I have begun to impress upon my students the importance of preserving this faraway place. It is one thing to read and talk about what’s going on in a rainforest and quite another thing to see it first hand.
This study was sponsored by Amazon Rainforest Workshops with technical support from Vernier. The Educator Academy in the Amazon Rainforest is a cross-curricular workshop for K–12 science educators to use and learn instructional approaches and protocols while exploring one of the world’s most important natural resources, the Amazon Rainforest. For more information, please visit www.amazonworkshops.com/educator-academy.html

