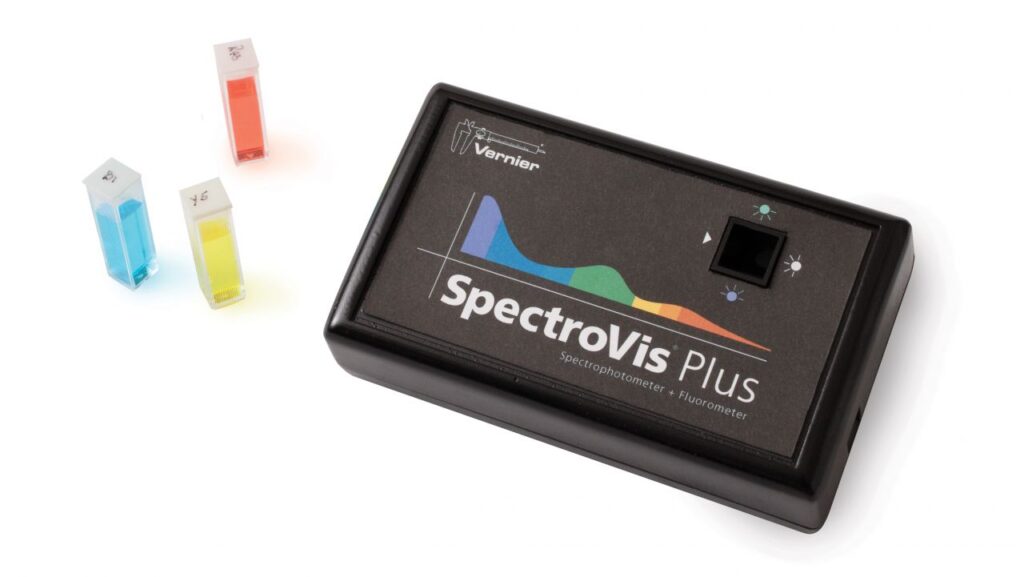
SpectroVis Plus (SVIS-PL, discontinued)
Troubleshooting
- Primary Test: Are you using Logger Pro v3.14, LabQuest App v2.7.2, or Spectral Analysis v4.4 (or newer)?
- Secondary Test: Is the USB cable securely connected?
Please read the user manual for general usage information.
Additional Troubleshooting
GENERAL
- My Spectrometer is not working properly. It won't calibrate or is giving very noisy data.
- How is the Go Direct SpectroVis Plus Spectrophotometer different than the SpectroVis Plus?
- How do I check the lamp output of my spectrometer?
- Why is the absorbance reading on my device (spectrometer/colorimeter) unstable or nonlinear at values above 1.0?
- Why don't all of my spectrometers and/or colorimeters read the same absorbance value for the same sample?
- Can the lamp in my spectrometer be replaced?
- Why don't the absorbance readings for the colorimeters and spectrometers have units?
- What do the numbers on the bottom label of the SpectroVis Plus mean?
- What is the path length for the Vernier-branded spectrometers?
- Can a SpectroVis Plus Spectrophotometer be repaired?
ACCESSORIES
- What is the difference between the types of cuvettes you sell for colorimeters and spectrophotometers?
- Do you sell replacement lids for your plastic cuvettes?
- What types of liquids can be poured into your plastic colorimeter or spectrophotometer cuvettes without harming the cuvette?
- Where can I get quartz cuvettes for your spectrophotometers?
- Are 4-sided clear cuvettes required when doing fluorescence experiments with SpectroVis Plus or Go Direct SpectroVis Plus?
- Does the Vernier Spectrophotometer Optical Fiber work with any of the Ocean Optics Spectrometers or vice versa?
- Which Optical Fiber will work with my Spectrometer?
SOFTWARE ISSUES
- Spectrometer Error: 'Could Not Collect Values' or 'Calibration Failed'
- Is there a way to toggle on/off the colored background behind the absorbance spectrum graph?
- When should I use the Intensity Correction for my Vernier-branded Spectrometer?
- Why is the maximum sample time for a spectrometer set at 1000 milliseconds?
- Why are there blank data table cells in my spectrometer absorbance data?
- Will the SpectroVis Plus or Go Direct SpectroVis Plus work with LoggerLite?
- How can I overlay two emission spectra graphs in Logger Pro?
- How can I display both Absorbance and % Transmittance, from Spectrometer measurements, in Logger Pro 3?
- Can I have my spectrometer capture full wavelength spectra episodically?
- I collected Absorbance data and then Fluorescence data (or emission data) with my spectrometer. I am now collecting Absorbance data again and my data does not look correct.
- LabQuest Not Recognizing SpectroVis Plus or Showing Bad Data
EXPERIMENTS
- Do you have labs written for your spectrophotometers?
- Can I use my spectrometer to collect data at one wavelength (Beer's law or kinetics)?
- How do I run the AP Chemistry food dye lab with a colorimeter instead of a spectrophotometer?
- Do you have instructions on how to use a spectrophotometer to conduct the Photosynthesis lab?
- Do you have an experiment written for quantitative analysis using the GDX-SVISPL fluorescence capabilities?
- Are there some readily-available substances I can use to measure fluorescence with a SpectroVis Plus?
- Can I do blackbody experiments with your Spectrometers?
- Why can't I see better Hydrogen emission lines with my spectrometer?
- Can I collect data with a spectrometer while using another sensor such as temperature or pH using Logger Pro?
Specifications
- Light Source: Incandescent with LED support
- Fluorescence: Excitation LEDs centered at 405 and 500 nm
- Detector: Linear CCD
- Wavelength Range: 380 to 950 nm
- Wavelength Reporting Interval: ~1 nm
- Optical Resolution: 4.0 nm (at 656 nm); 25 nm (at 486 nm)
(as determined by the full width of half maximum of designated hydrogen emission peak) - Wavelength Accuracy: ±3.0 nm (at 650 nm); ±7.0 nm (at 450 nm)
(as determined with holmium oxide NIST standard) - Photometric Accuracy: ± 13.0%
(as determined with nickel sulfate standards between 0.1–1.0 AU) - Typical Scan Time: ~2 s
- Operating Temperature: 15 to 35ºC
- Dimensions: 15 cm × 9 cm × 4 cm
- Z Dimension (Beam Height): 19 mm
Calibration
Calibrate this sensor? Yes, in absorbance and transmittance modes. Calibration when using emissions or fluorescence modes is optional. See calibration instructions below:
- Start the calibration.
⚬ Logger Pro: Choose Calibrate ▶ Spectrophotometer from the Experiment menu.
⚬ LabQuest App: Choose Calibrate ▶ USB: Spectrophotometer from the Sensors menu.
⚬ Spectral Analysis: Select to start an Absorbance or Transmittance experiment.
Note: For best results, allow the Spectrophotometer to warm up for a minimum of five minutes. - Fill a cuvette about 3/4 full with distilled water (or the solvent being used in the experiment) to serve as the blank. After the spectrophotometer has warmed up, place the blank cuvette in the spectrophotometer. Align the cuvette so a clear side of the cuvette is facing the light source.
- Follow the instructions in the dialog box to complete the calibration, and then tap OK.
Related Products
- SpectroVis Optical Fiber (SVIS-FIBER, discontinued)
- Plastic Cuvettes (4 sided - Clear) (
CUV-4S ) - Plastic Cuvettes (UV-VIS) (
CUV-UV ) - Cuvette Rack (
CUV-RACK ) - Mini USB-C Cable (
CB-USB-C-MINI ) - Go Direct® SpectroVis® Plus Spectrophotometer (
GDX-SVISPL )
Replacement Parts
- Mini USB Cable (
CB-USB-MINI ) - Plastic Cuvettes (Visible Range) (
CUV ) - Cuvette Lids (100 per pack) (
CUV-LID )
For information on the original SpectroVis (SVIS), refer to its
Specifications and User Guide.