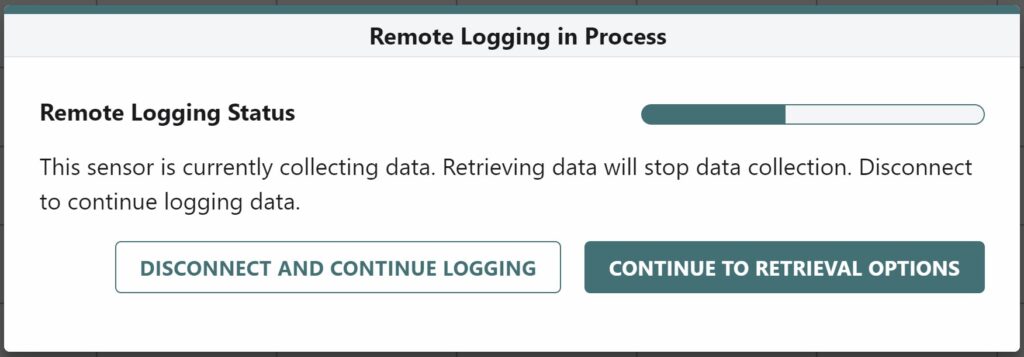
Once a remote data logging experiment has been started, there is no option to view data that are being stored on the Go Direct device. The only way to view the data is to retrieve and clear the data from the Go Direct sensor. However, it is possible to check the status of the experiment in progress, and find out how many samples have been collected. When checking the status, data collection continues without pause.
Steps to check the remote logging status
- Check that the Go Direct sensor’s Bluetooth LED is giving a green, double flash,
 . This indicates that the Go Direct sensor is actively collecting and storing remote data.
 - Launch Graphical Analysis and connect your Go Direct sensor via Bluetooth or USB.
For detailed instructions for connecting the sensor to the Graphical Analysis app, refer to Getting Started with Go Direct Sensors. - Once the sensor is connected, the Remote Logging in Process dialog will appear.

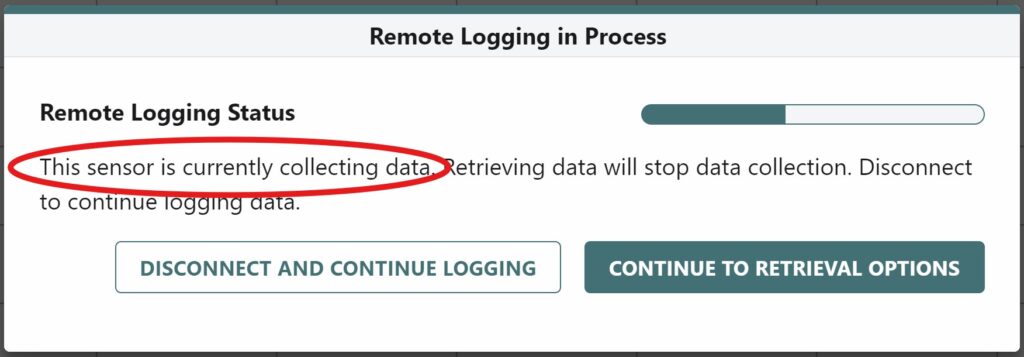
- Check the Remote Logging Status to determine if the sensor is actively collecting data.

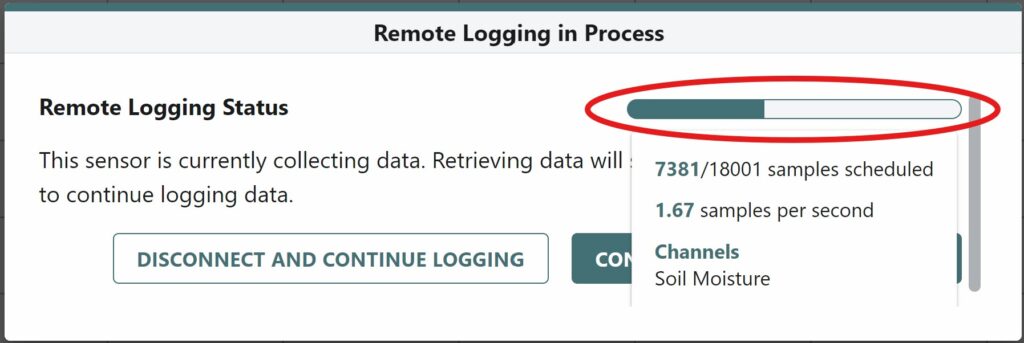
- Click on the Status bar in the top right corner. This will provide information on how many samples have been collected, the sampling rate, and the configured channels.

- You can leave the Remote Logging in Process dialog open as long as you want. Data collection continues, and the status bar updates in real time. When ready to close the dialog, click the DISCONNECT AND CONTINUE LOGGING button.
Tips to help insure that data are being properly collected and stored on your Go Direct device
- Follow the instructions in the Remote Data Logging: Trial Run to become familiar with the process of conducting a remote data logging experiment.
- Perform a test run. Configure your Go Direct sensor for your remote data logging experiment and let the experiment run for several minutes to an hour. Retrieve the data and confirm that the configured sensor channels are collecting as expected.
- Consider running the experiment in phases. Configure the Go Direct sensor to log data for a portion of the total experiment. Retrieve the data and save the Graphical Analysis file. Configure the Go Direct sensor for a second run and log more data. Open the saved Graphical Analysis file and retrieve the next set of data.
