Remote data logging is a feature that allows select models of Go Direct sensors to store data directly to their memory. The Vernier Graphical Analysis app (Basic or Pro) is used to both configure the device for the experiment, and to retrieve the data from the Go Direct device following the completion of the experiment. For more details, visit the Remote Data Logging Landing Page
TROUBLESHOOTING
- Confirm that your Go Direct device has the capability to perform remote data logging
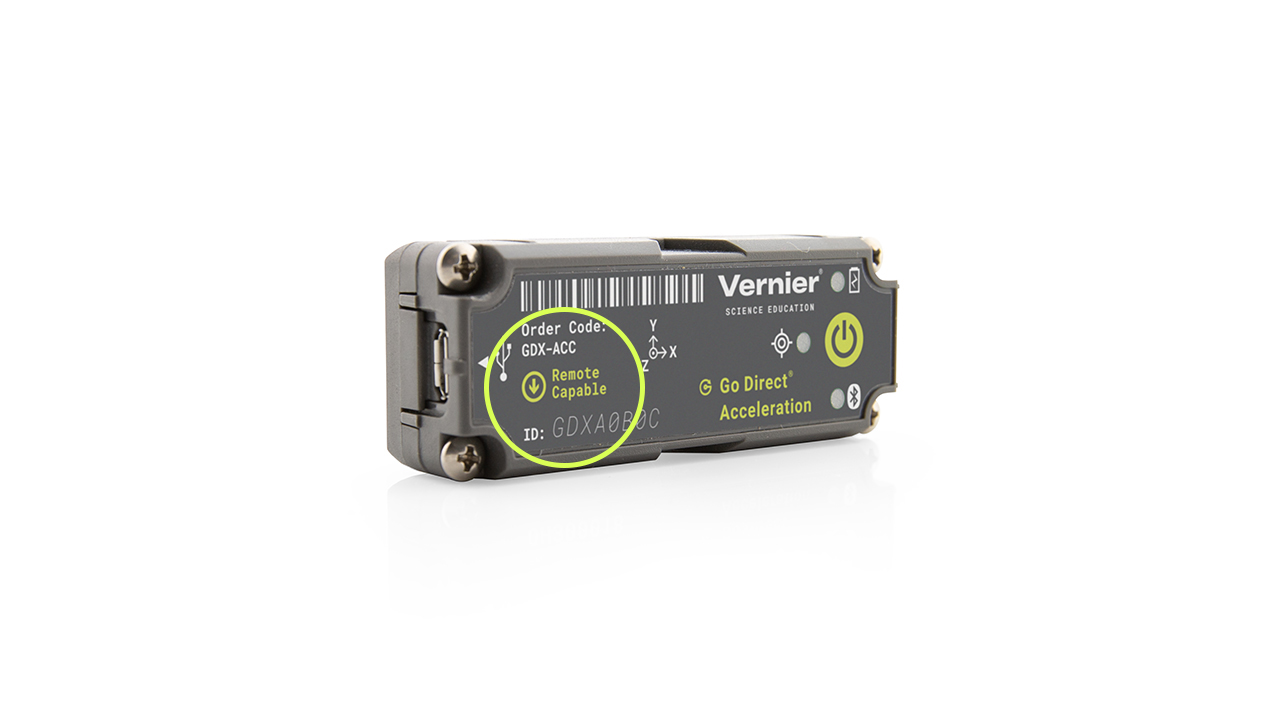
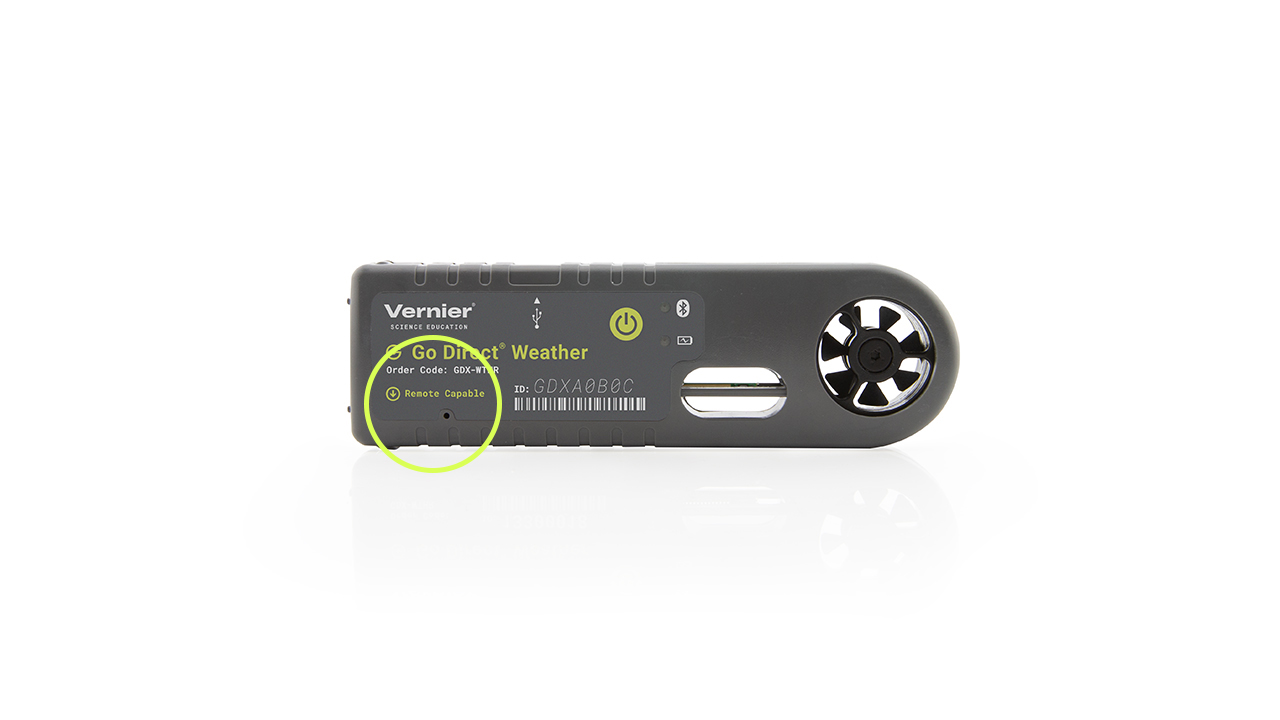
- Sensors with this capability are labeled with a Remote Data Logging symbol,
 , for easy identification. Look for this symbol on the sensor label. The figures below have highlighted where to look for the symbol on the Go Direct® Acceleration Sensor (GDX-ACC), and the Go Direct® Weather System (GDX-WTHR):

- The most up-to-date list of Go Direct sensors with the remote data logging feature can be found on the Remote Data Logging Landing Page.
- Sensors with this capability are labeled with a Remote Data Logging symbol,
- You must be using Graphical Analysis app v6.1 (or newer).
- Follow the instructions in the document, Remote Data Logging: Trial Run
- Configuring remote data logging in Graphical Analysis is only possible with one Go Direct device connected. If multiple devices are connected, the remote data logging feature will be grayed out.
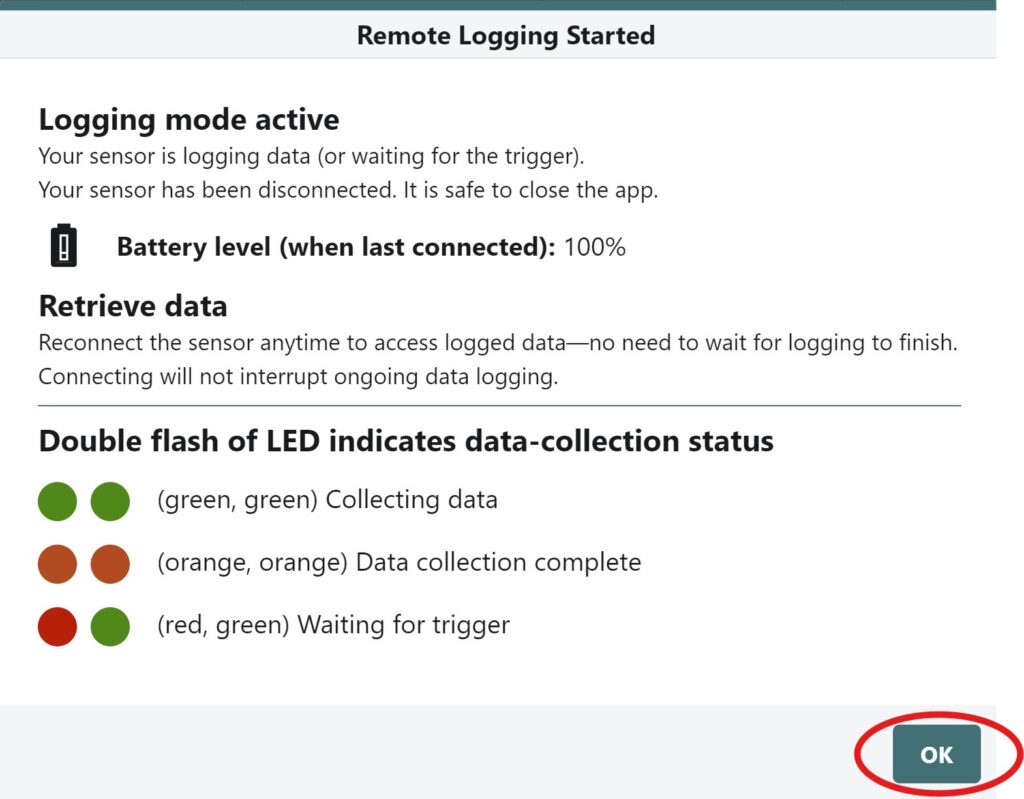
- After clicking the Start Logging button, make sure that the Go Direct sensor is disconnected from Graphical Analysis and that the dialog box is closed properly by clicking the OK button.

FREQUENTLY ASKED QUESTIONS (FAQs)
- Is there a way to update Go Direct sensors with the remote data logging feature?
- How long will my battery last for my remote data logging experiment?
- Which sensors are equipped with the remote data logging feature?
- How do I configure multiple channels of my Go Direct device for remote data logging?
- How do I start a remote data logging experiment on a triggering event?
- How do I zero my sensor for a remote data logging experiment?
- How do I check the status of my sensor during a remote data logging experiment?
- How do I bring remote logging data from multiple devices or multiple runs into a single Graphical Analysis file?
