Introduction
Wind turbine power curves describe how much power a wind turbine can extract from the wind at a variety of different wind speeds. Most power curves have a fairly similar shape, but each model of wind turbine has a unique power curve based on its design characteristics. By examining the power curve, you can tell the wind speed at which a wind turbine will start generating power, the wind speed at which it produces its maximum power output, and in what range of wind speeds it can safely operate.
The following concepts are important to understand when discussing power curves for wind turbines:
Cut-in Speed: The cut-in speed is the wind speed at which the turbine blades begin to rotate the generator shaft. This value is dependent on the number of blades, blade design, turbine inertia, and how smoothly the generator operates (gears or other friction elements in the drive train can affect this).
Maximum Power Output: This value is the maximum amount of power the turbine can produce. In Figure 1, the maximum amount of power the turbine can produce is approximately 105 kW at a wind speed of about 15 m/s.
Overspeed Protection: A wind turbine must be able to protect itself by slowing down in extreme wind speeds (in the example, above 15 m/s). At these speeds, the rotor or generator may spin too fast and cause electrical or mechanical problems. To mitigate the potential for damage, engineers have developed several different strategies: 1) feathering or adjusting blade pitch to make the blades less aerodynamic 2) applying a mechanical brake to slow the rotor 3) furling or turning the rotor so the plane of the rotor is parallel to the wind direction rather than perpendicular.
Power curves help us understand certain characteristics of a wind turbine, such as how much instantaneous power a turbine may generate at a specific wind speed. However, power curves do not necessarily give us a good idea of how much energy a wind turbine will produce at a given location because average wind speeds are generally well below the wind speed required for maximum power output.
Objectives
- Describe a power curve and its importance in understanding blade efficiency.
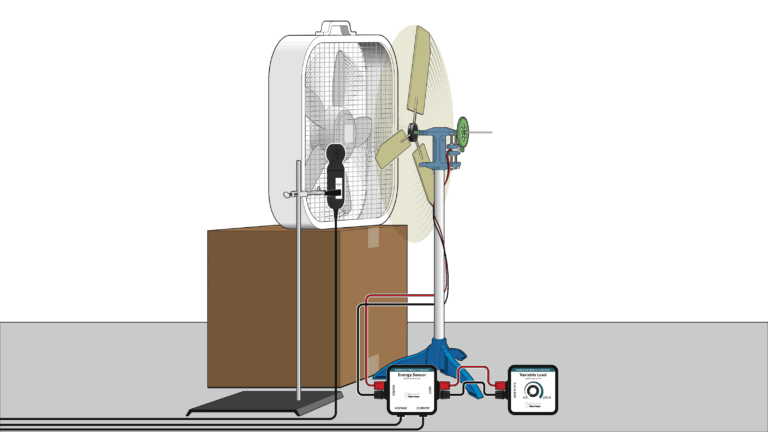
- Generate a power curve for a classroom wind turbine.
Sensors and Equipment
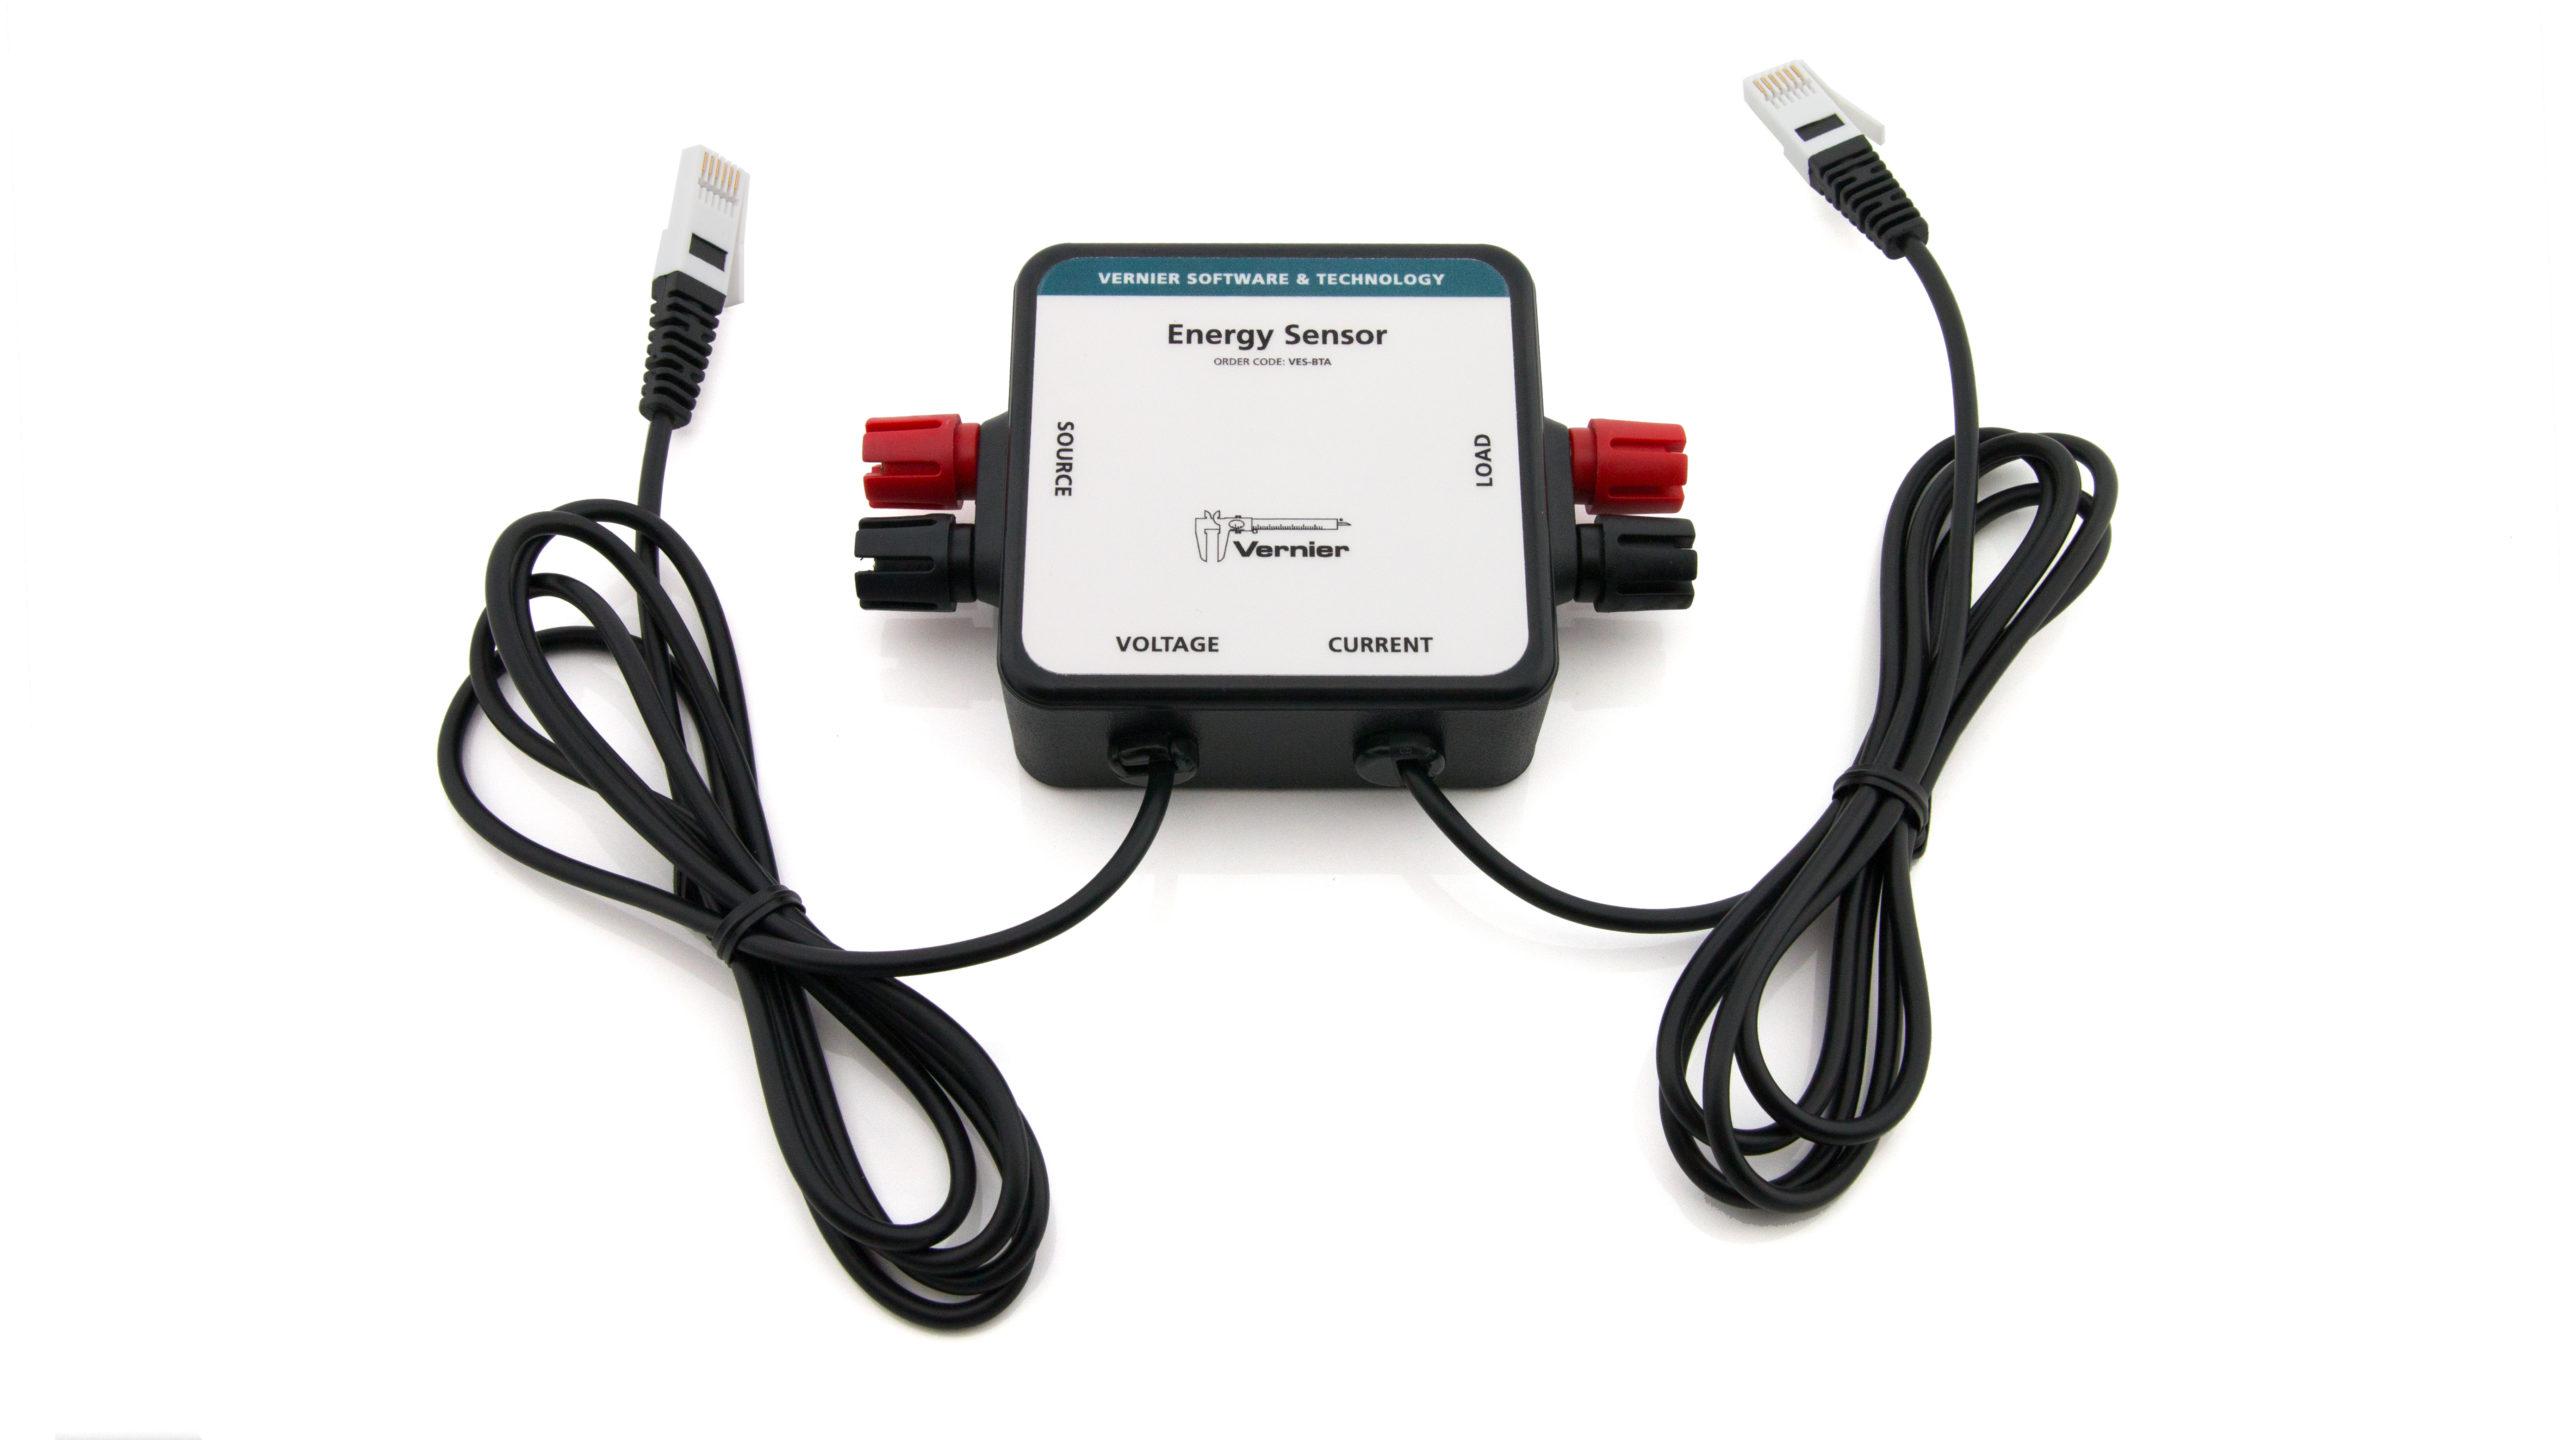
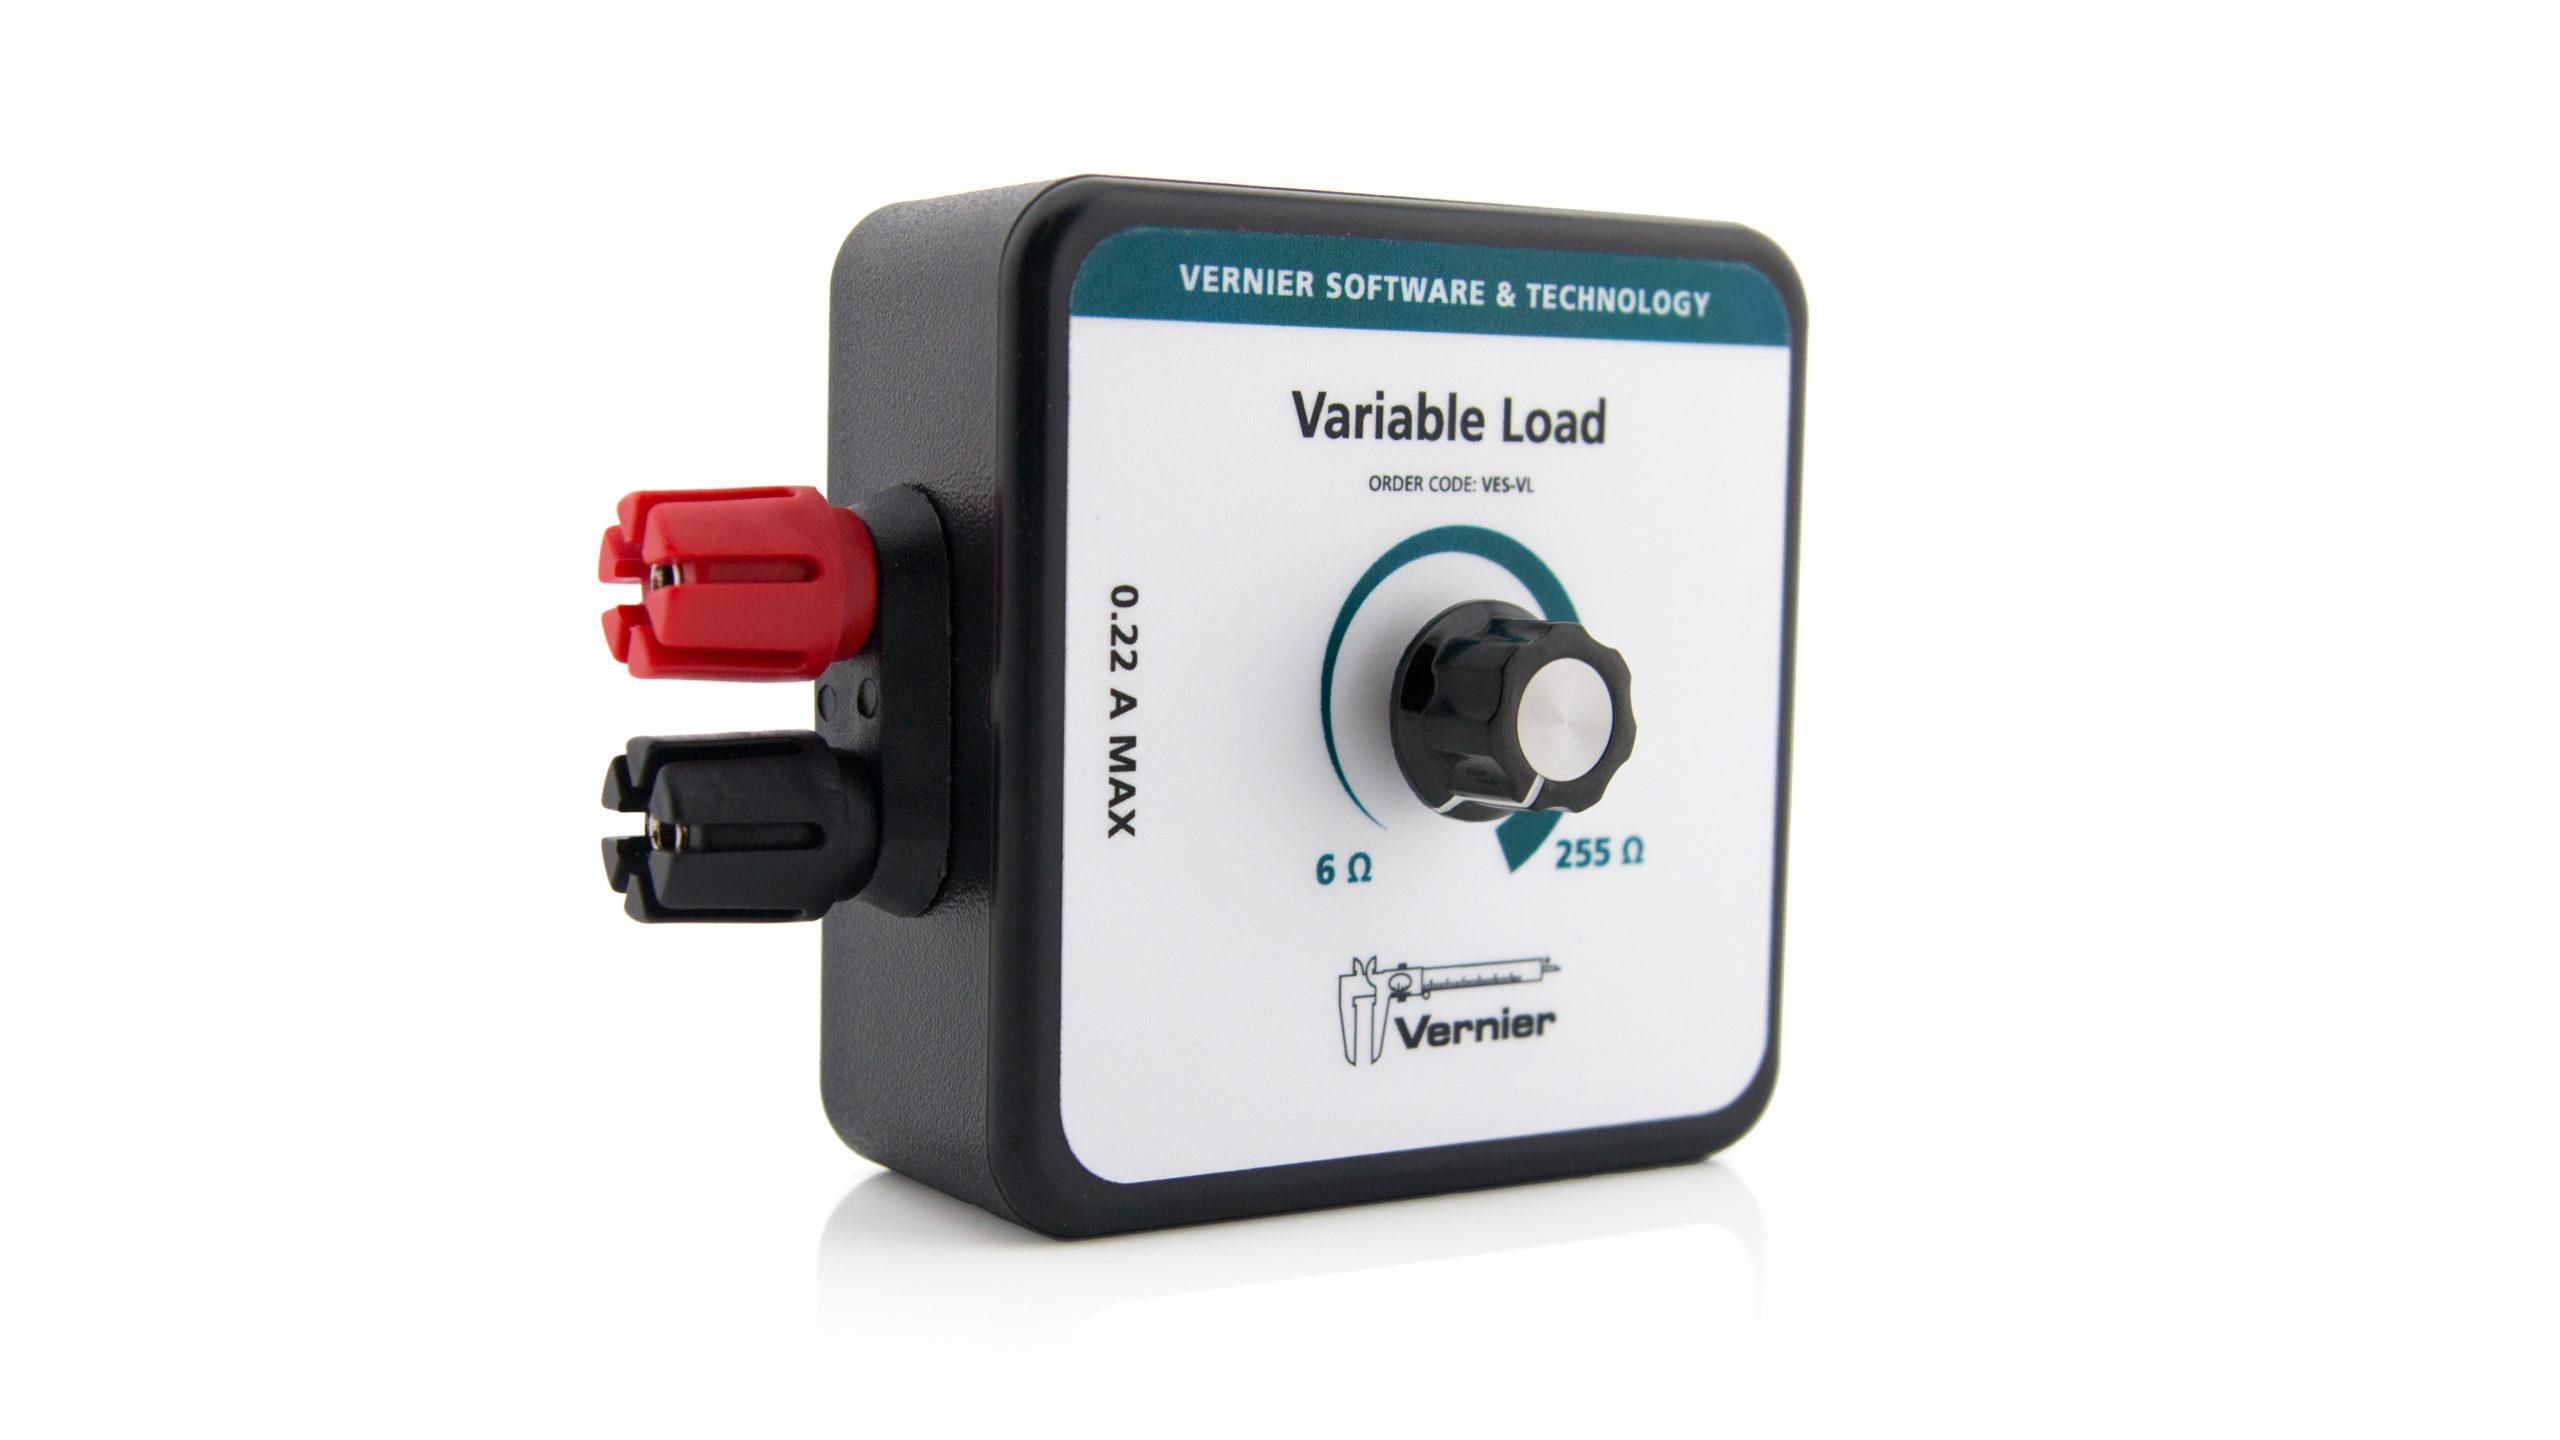
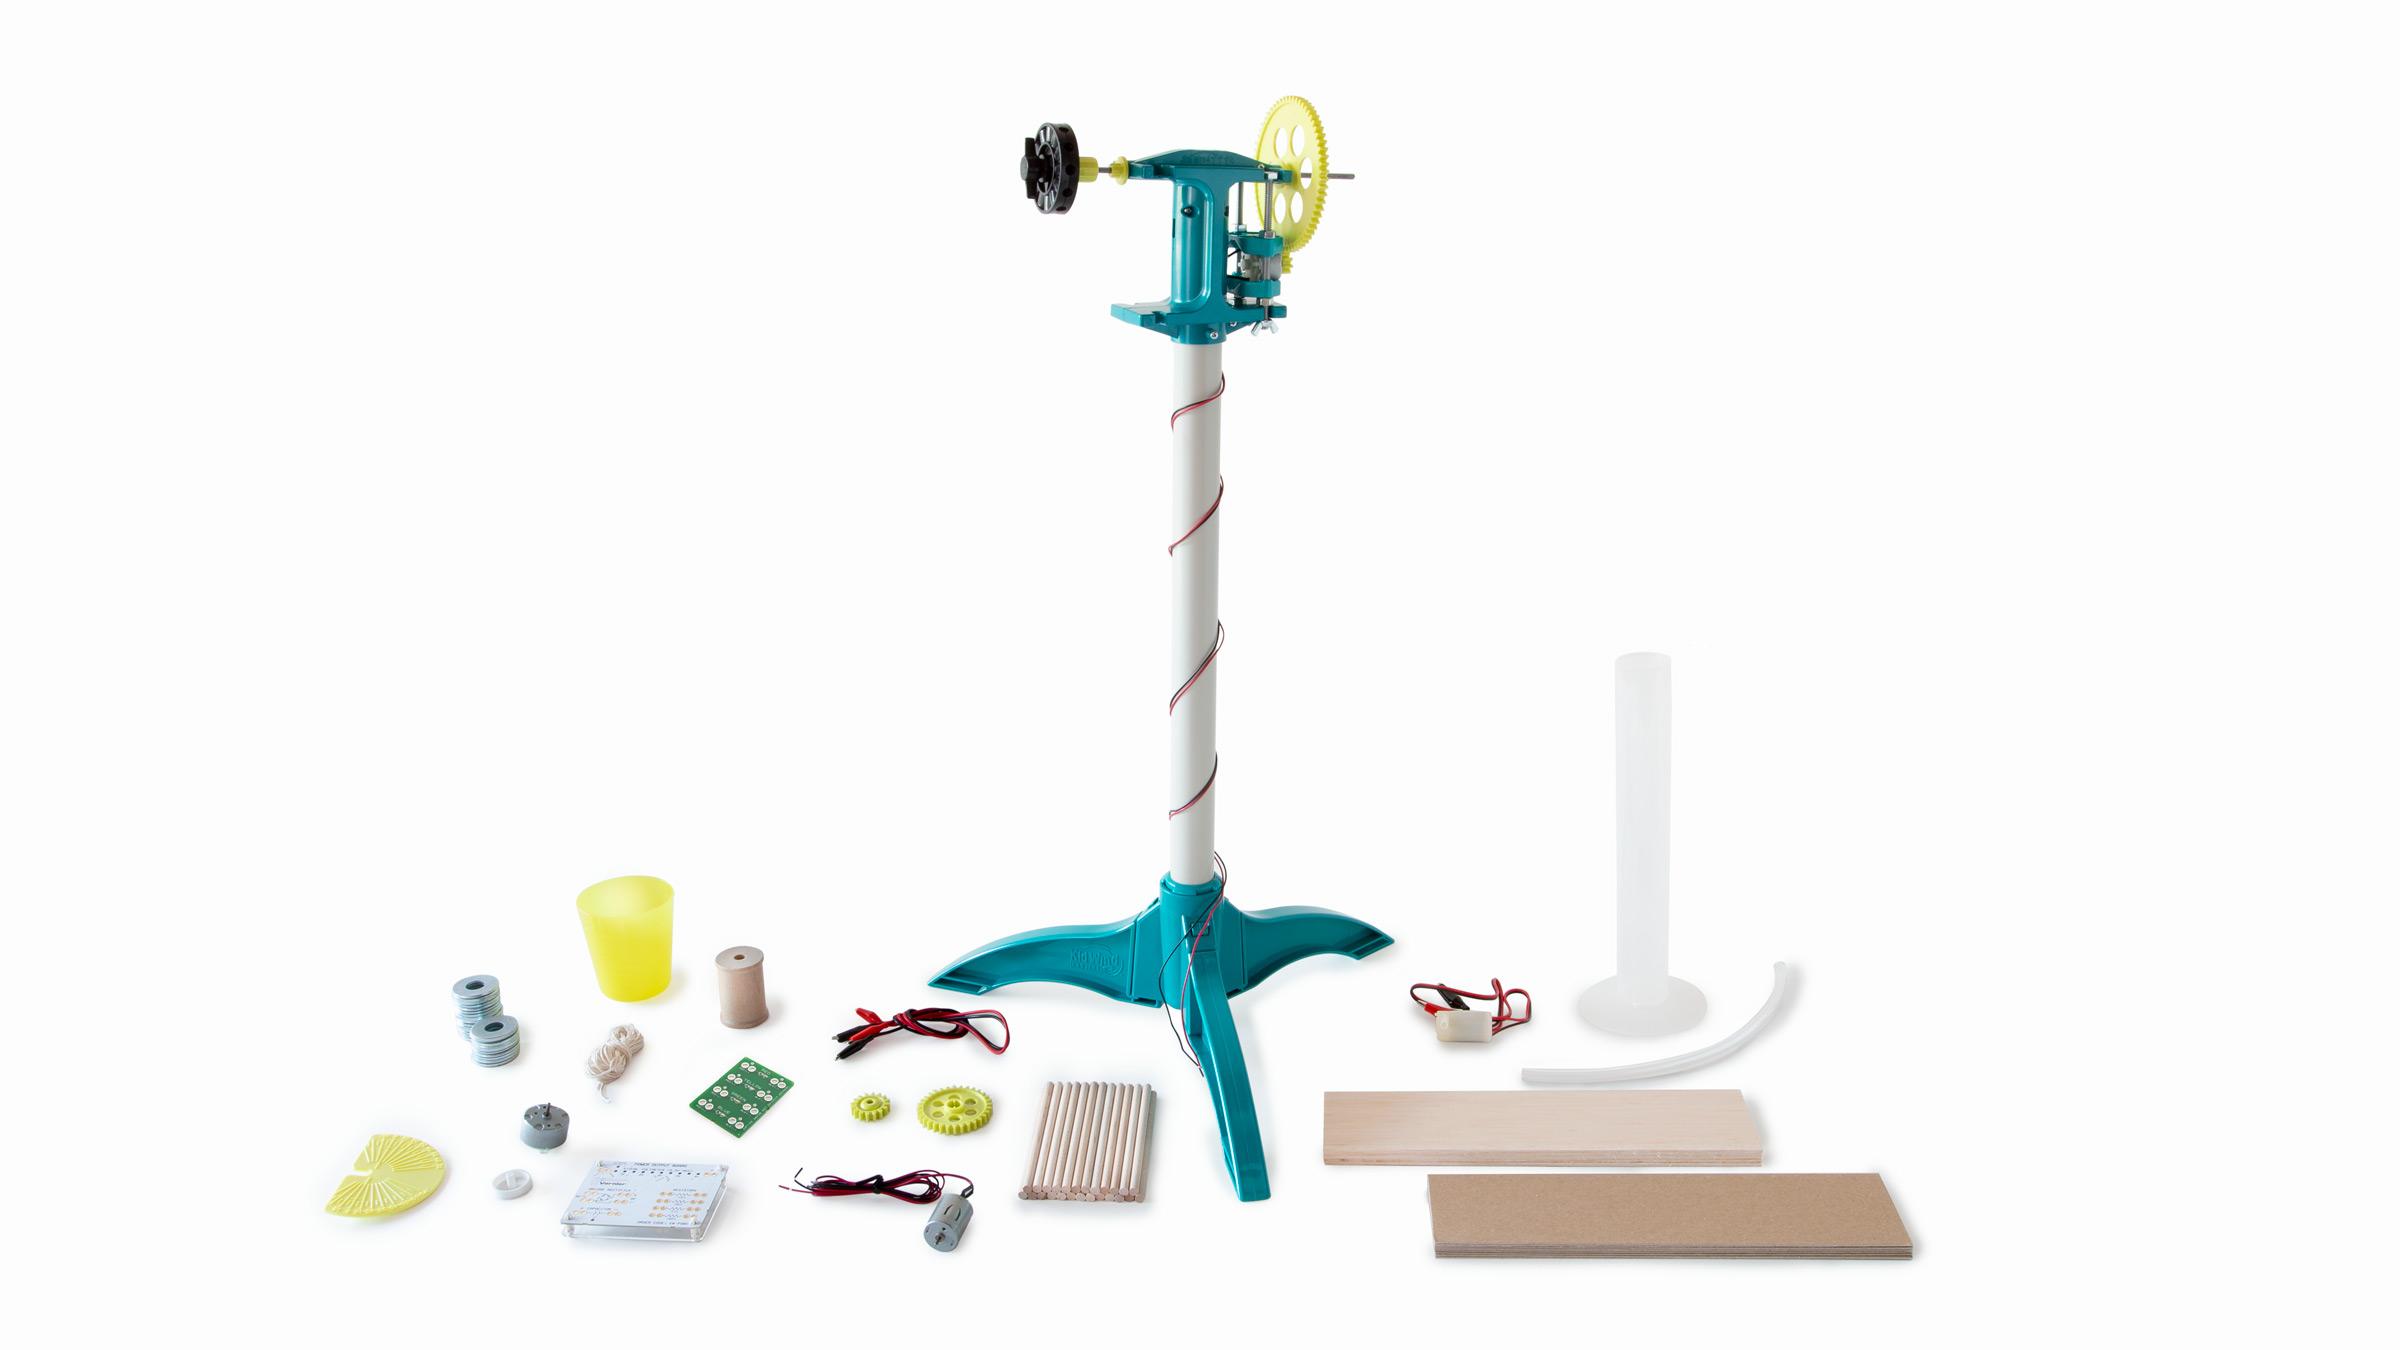
This experiment features the following sensors and equipment. Additional equipment may be required.
Ready to Experiment?
Ask an Expert
Get answers to your questions about how to teach this experiment with our support team.
- Call toll-free: 888-837-6437
- Chat with Us
- Email support@vernier.com
Purchase the Lab Book
This experiment is #13 of Renewable Energy with Vernier. The experiment in the book includes student instructions as well as instructor information for set up, helpful hints, and sample graphs and data.

