Standing Waves in a Column of Air
Experiment #4 from Advanced Physics with Vernier — Beyond Mechanics
- Subject
- Physics

Introduction
When you shake a string, a pulse travels down its length. When it reaches the end, the pulse can be reflected. A series of regularly occurring pulses will generate traveling waves that, after reflection from the other end, will interfere with the oncoming waves. When the conditions are right, the superposition of these waves traveling in opposite directions can give rise to something known as a “standing wave.” That is, there appear to be stationary waves on the string with some parts of the string hardly moving at all and other regions where the string experiences a large displacement. Standing waves can be set up in other materials such as a column of air in a tube. These standing waves are responsible for the tones produced by wind instruments.
In this experiment, you will examine these standing wave patterns and use what you know about frequency and wavelength to determine the speed of sound in air.
Objectives
In this experiment, you will
- Set up standing wave patterns in a column of air in open-end and closed-end tubes.
- Determine the relationship between tube length and wavelength for these standing waves.
- Use transverse wave patterns to describe the nodes and antinodes that occur in a column of air in open-end and closed-end tubes.
- Determine the speed of sound in air.
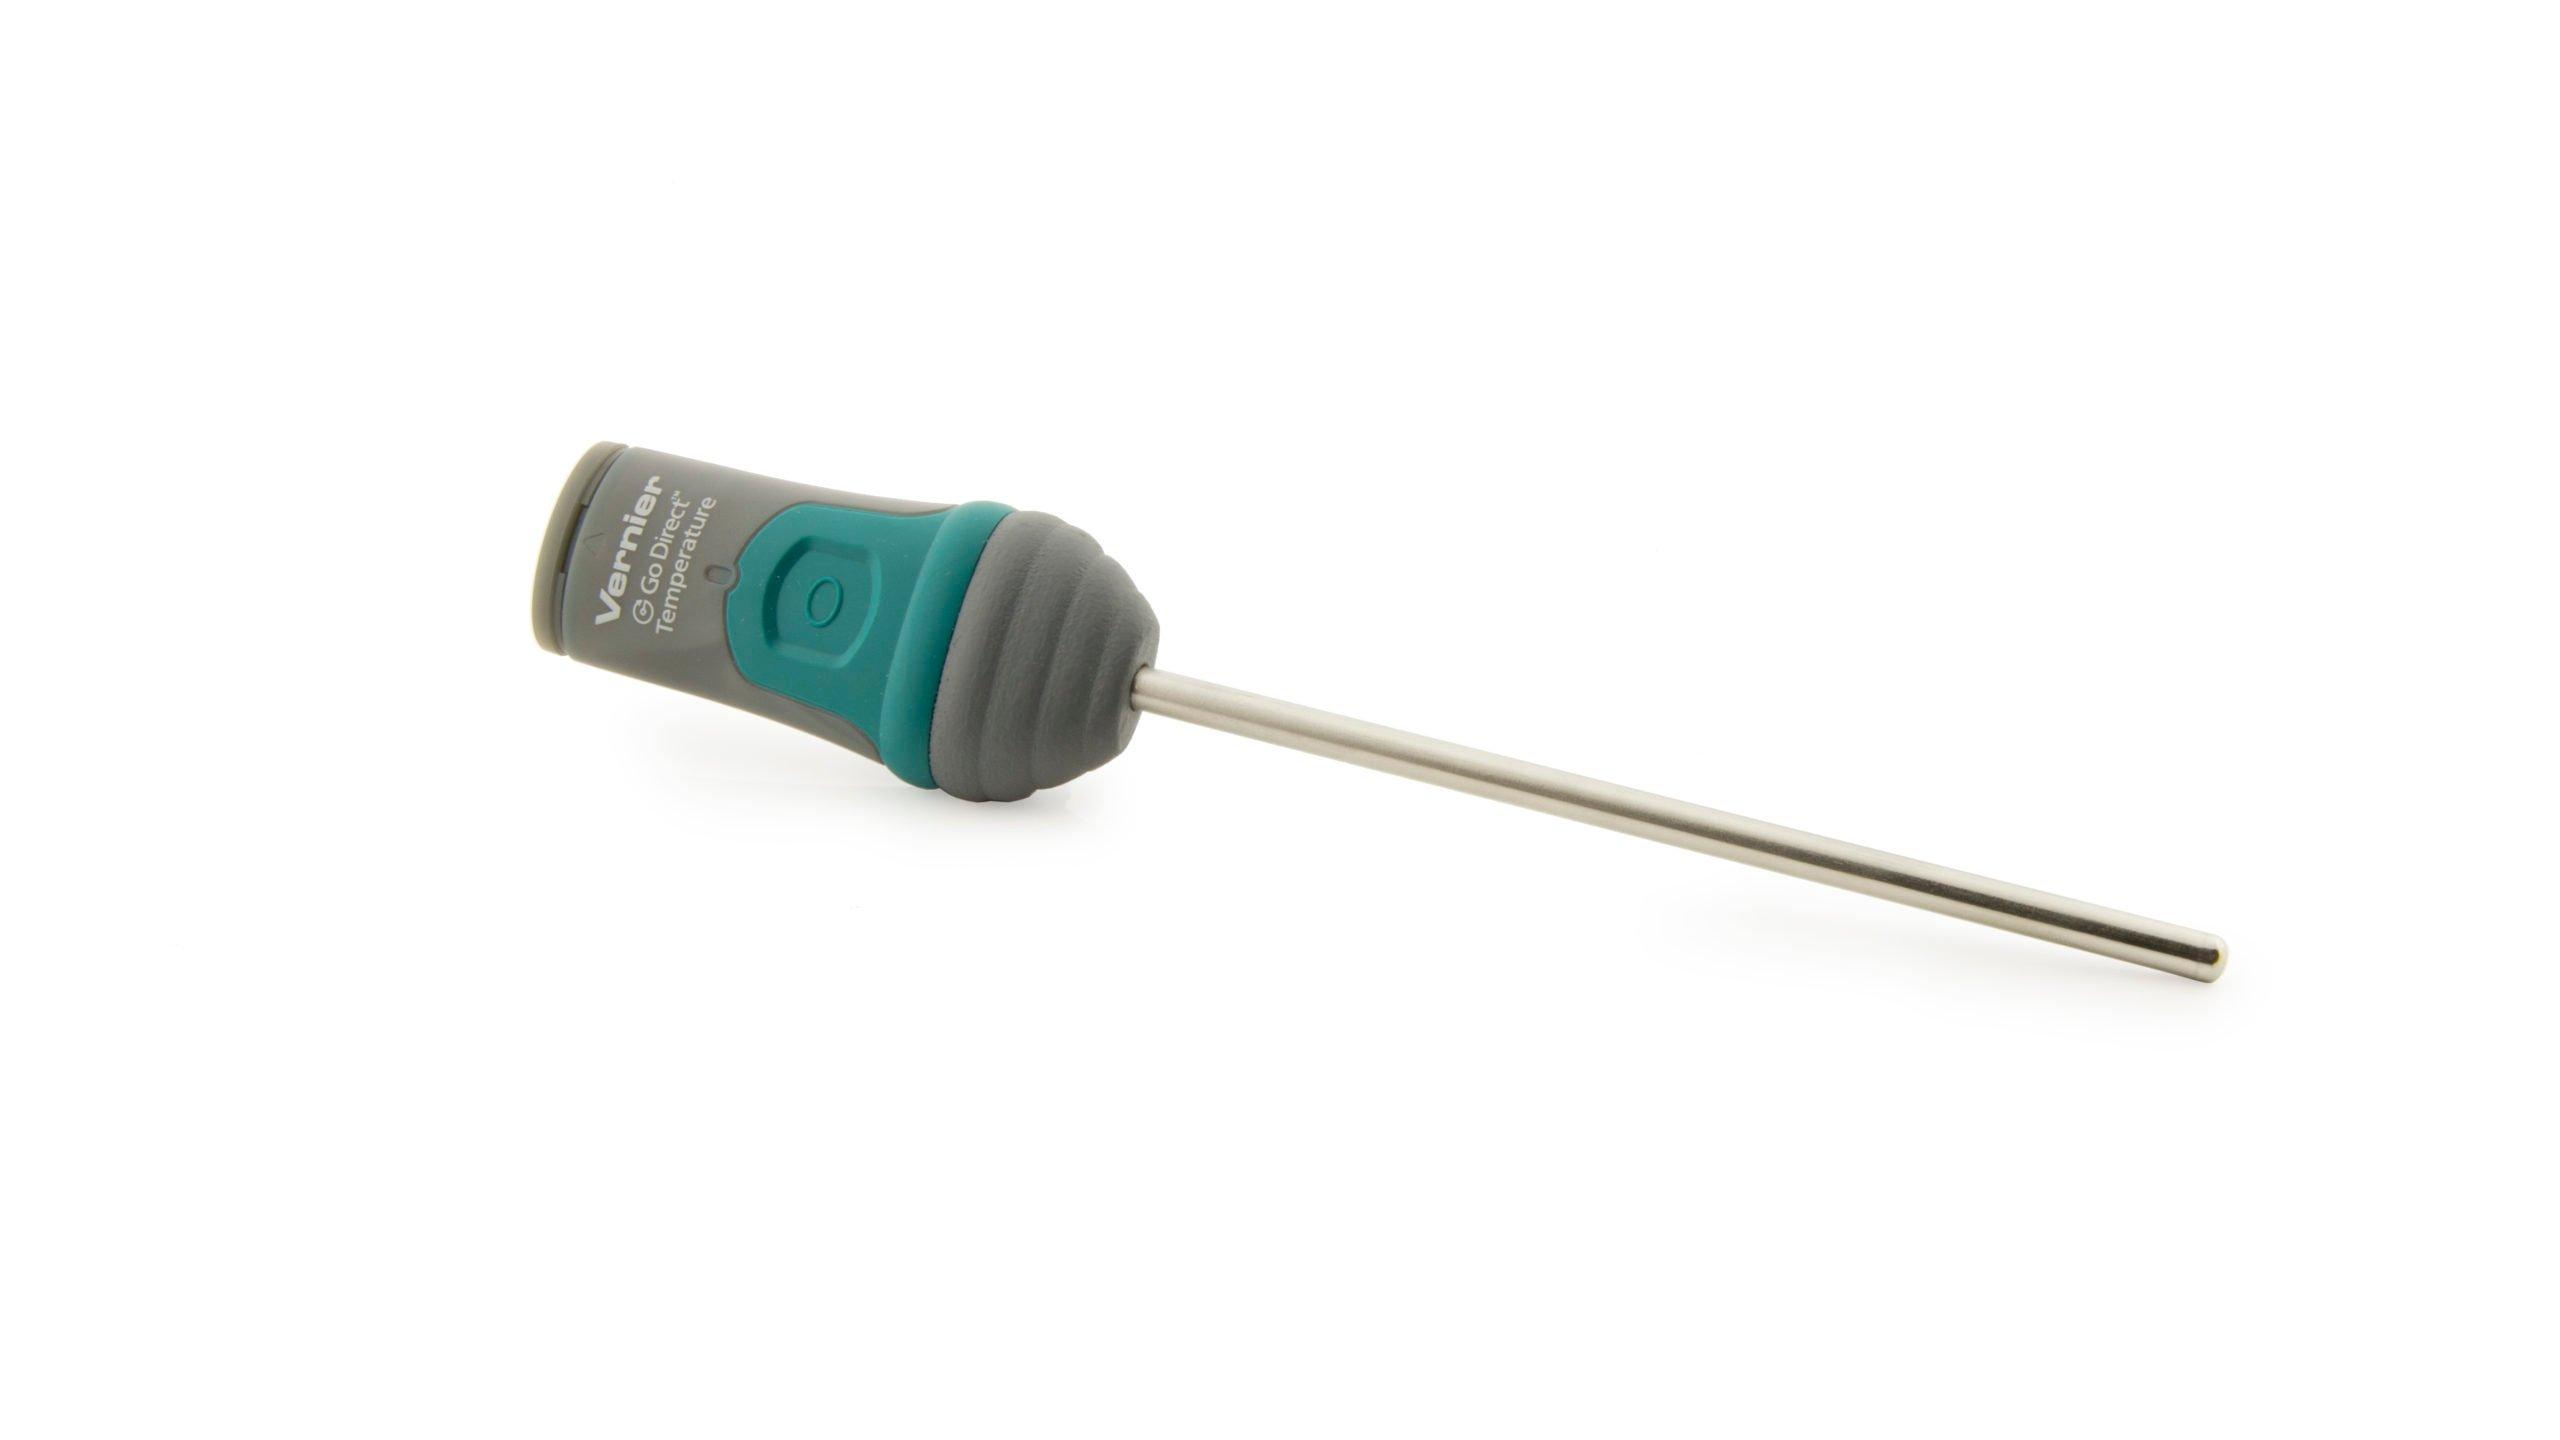
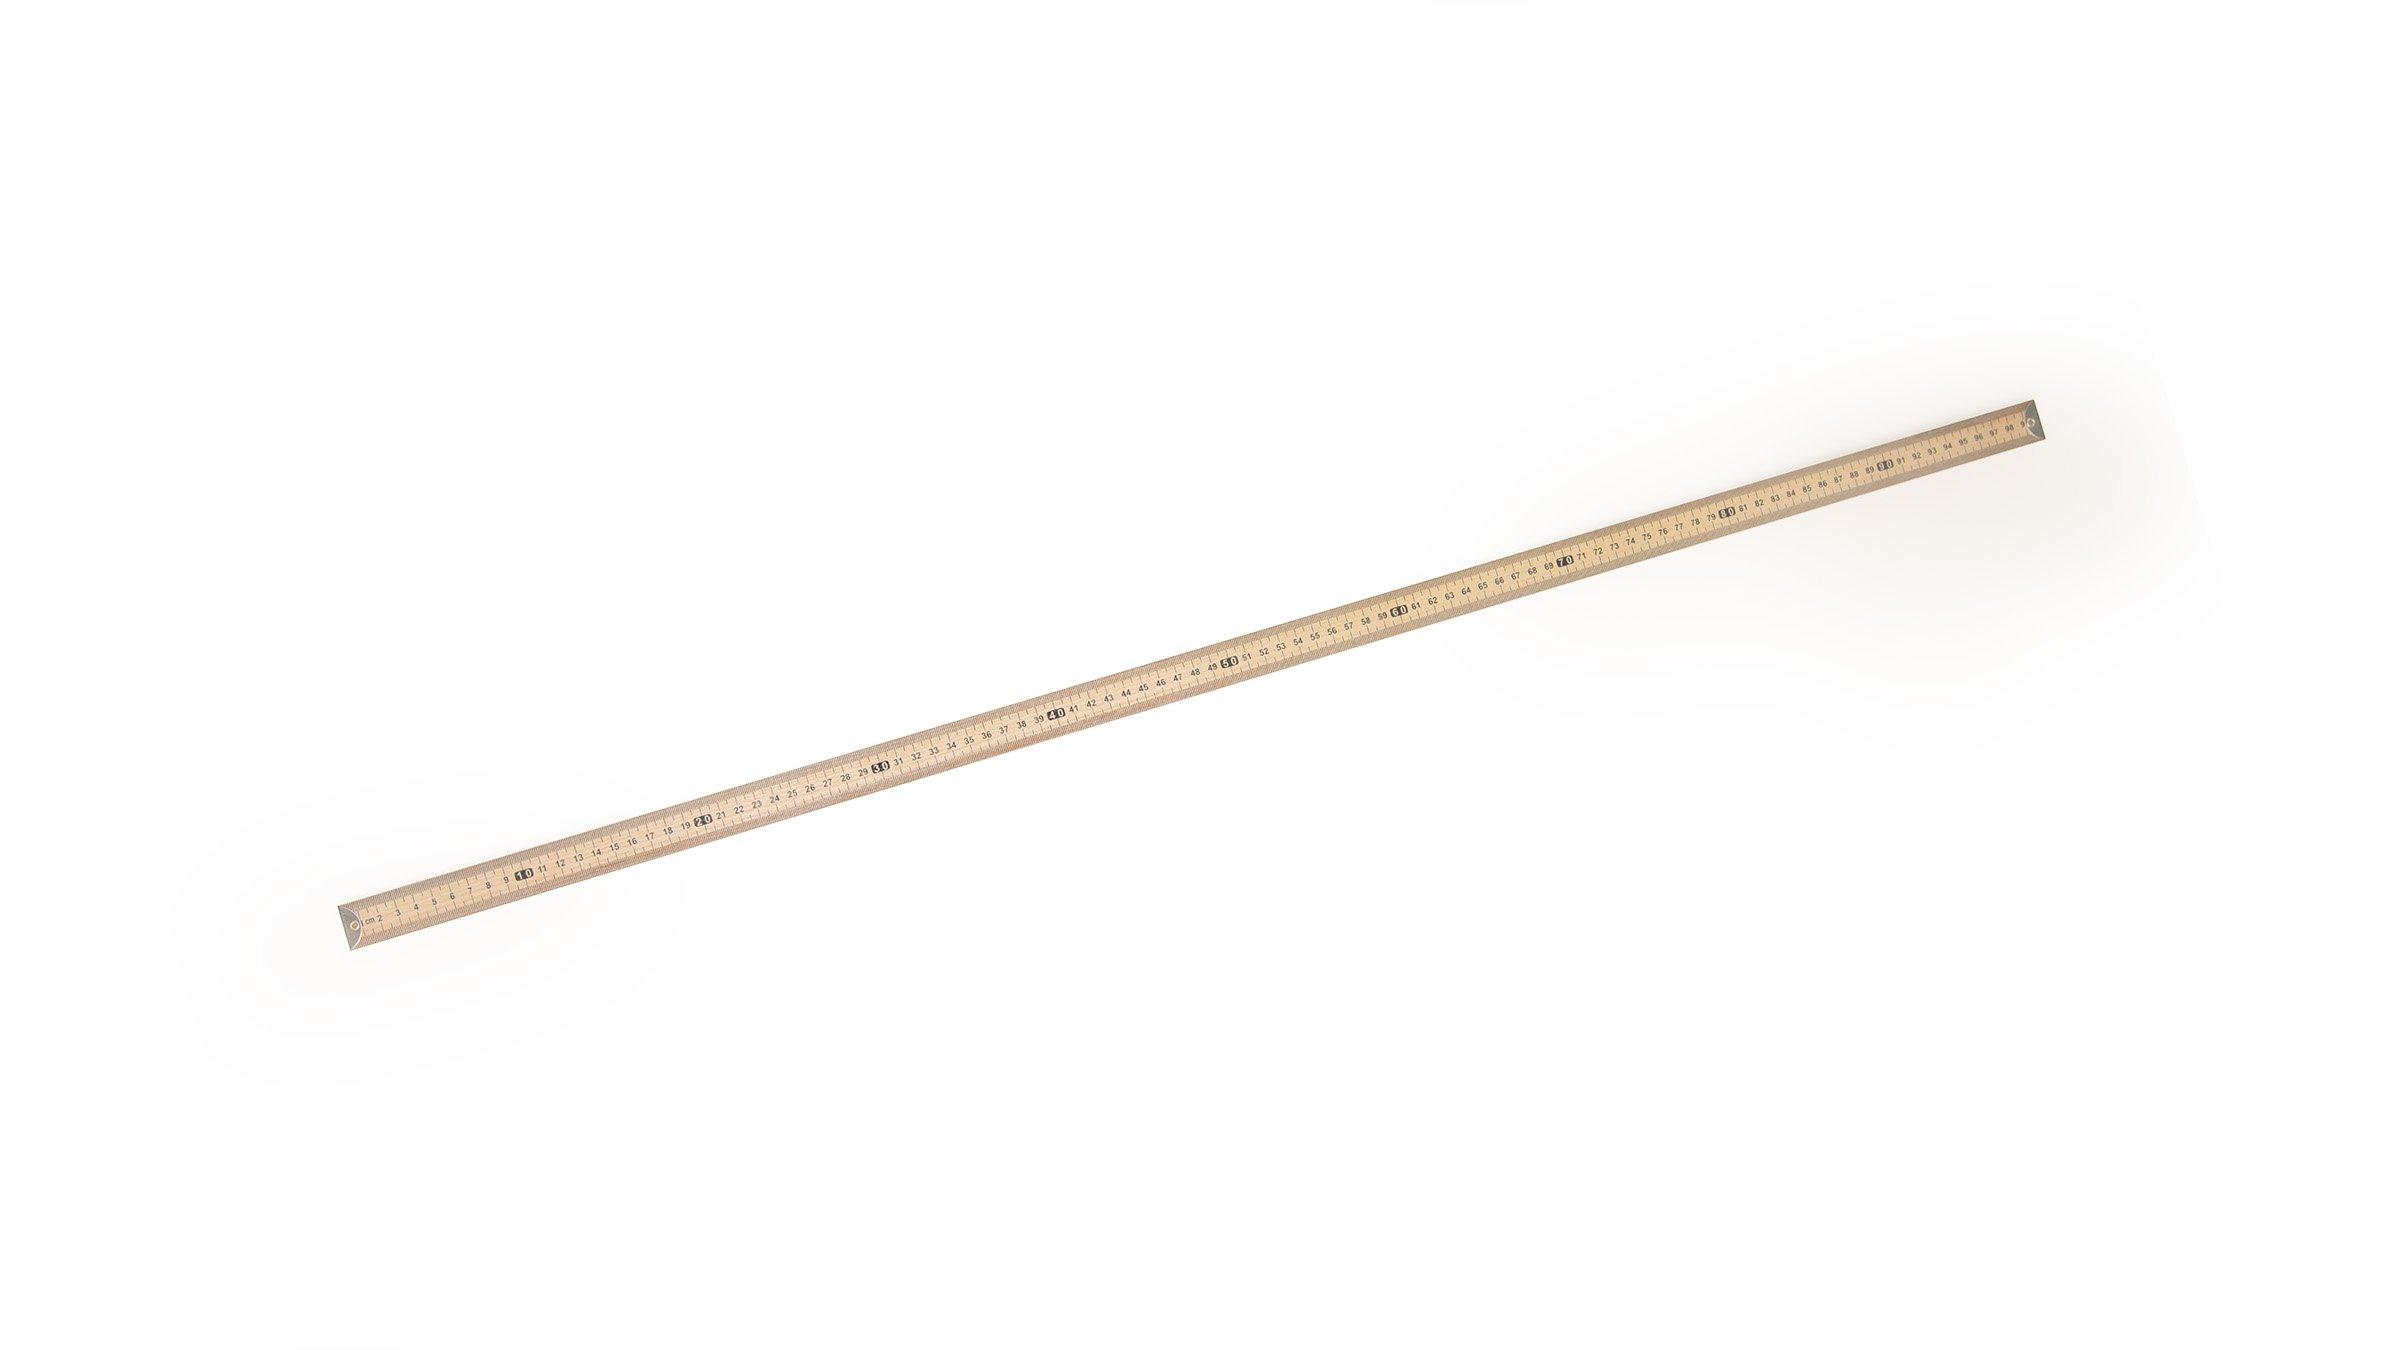
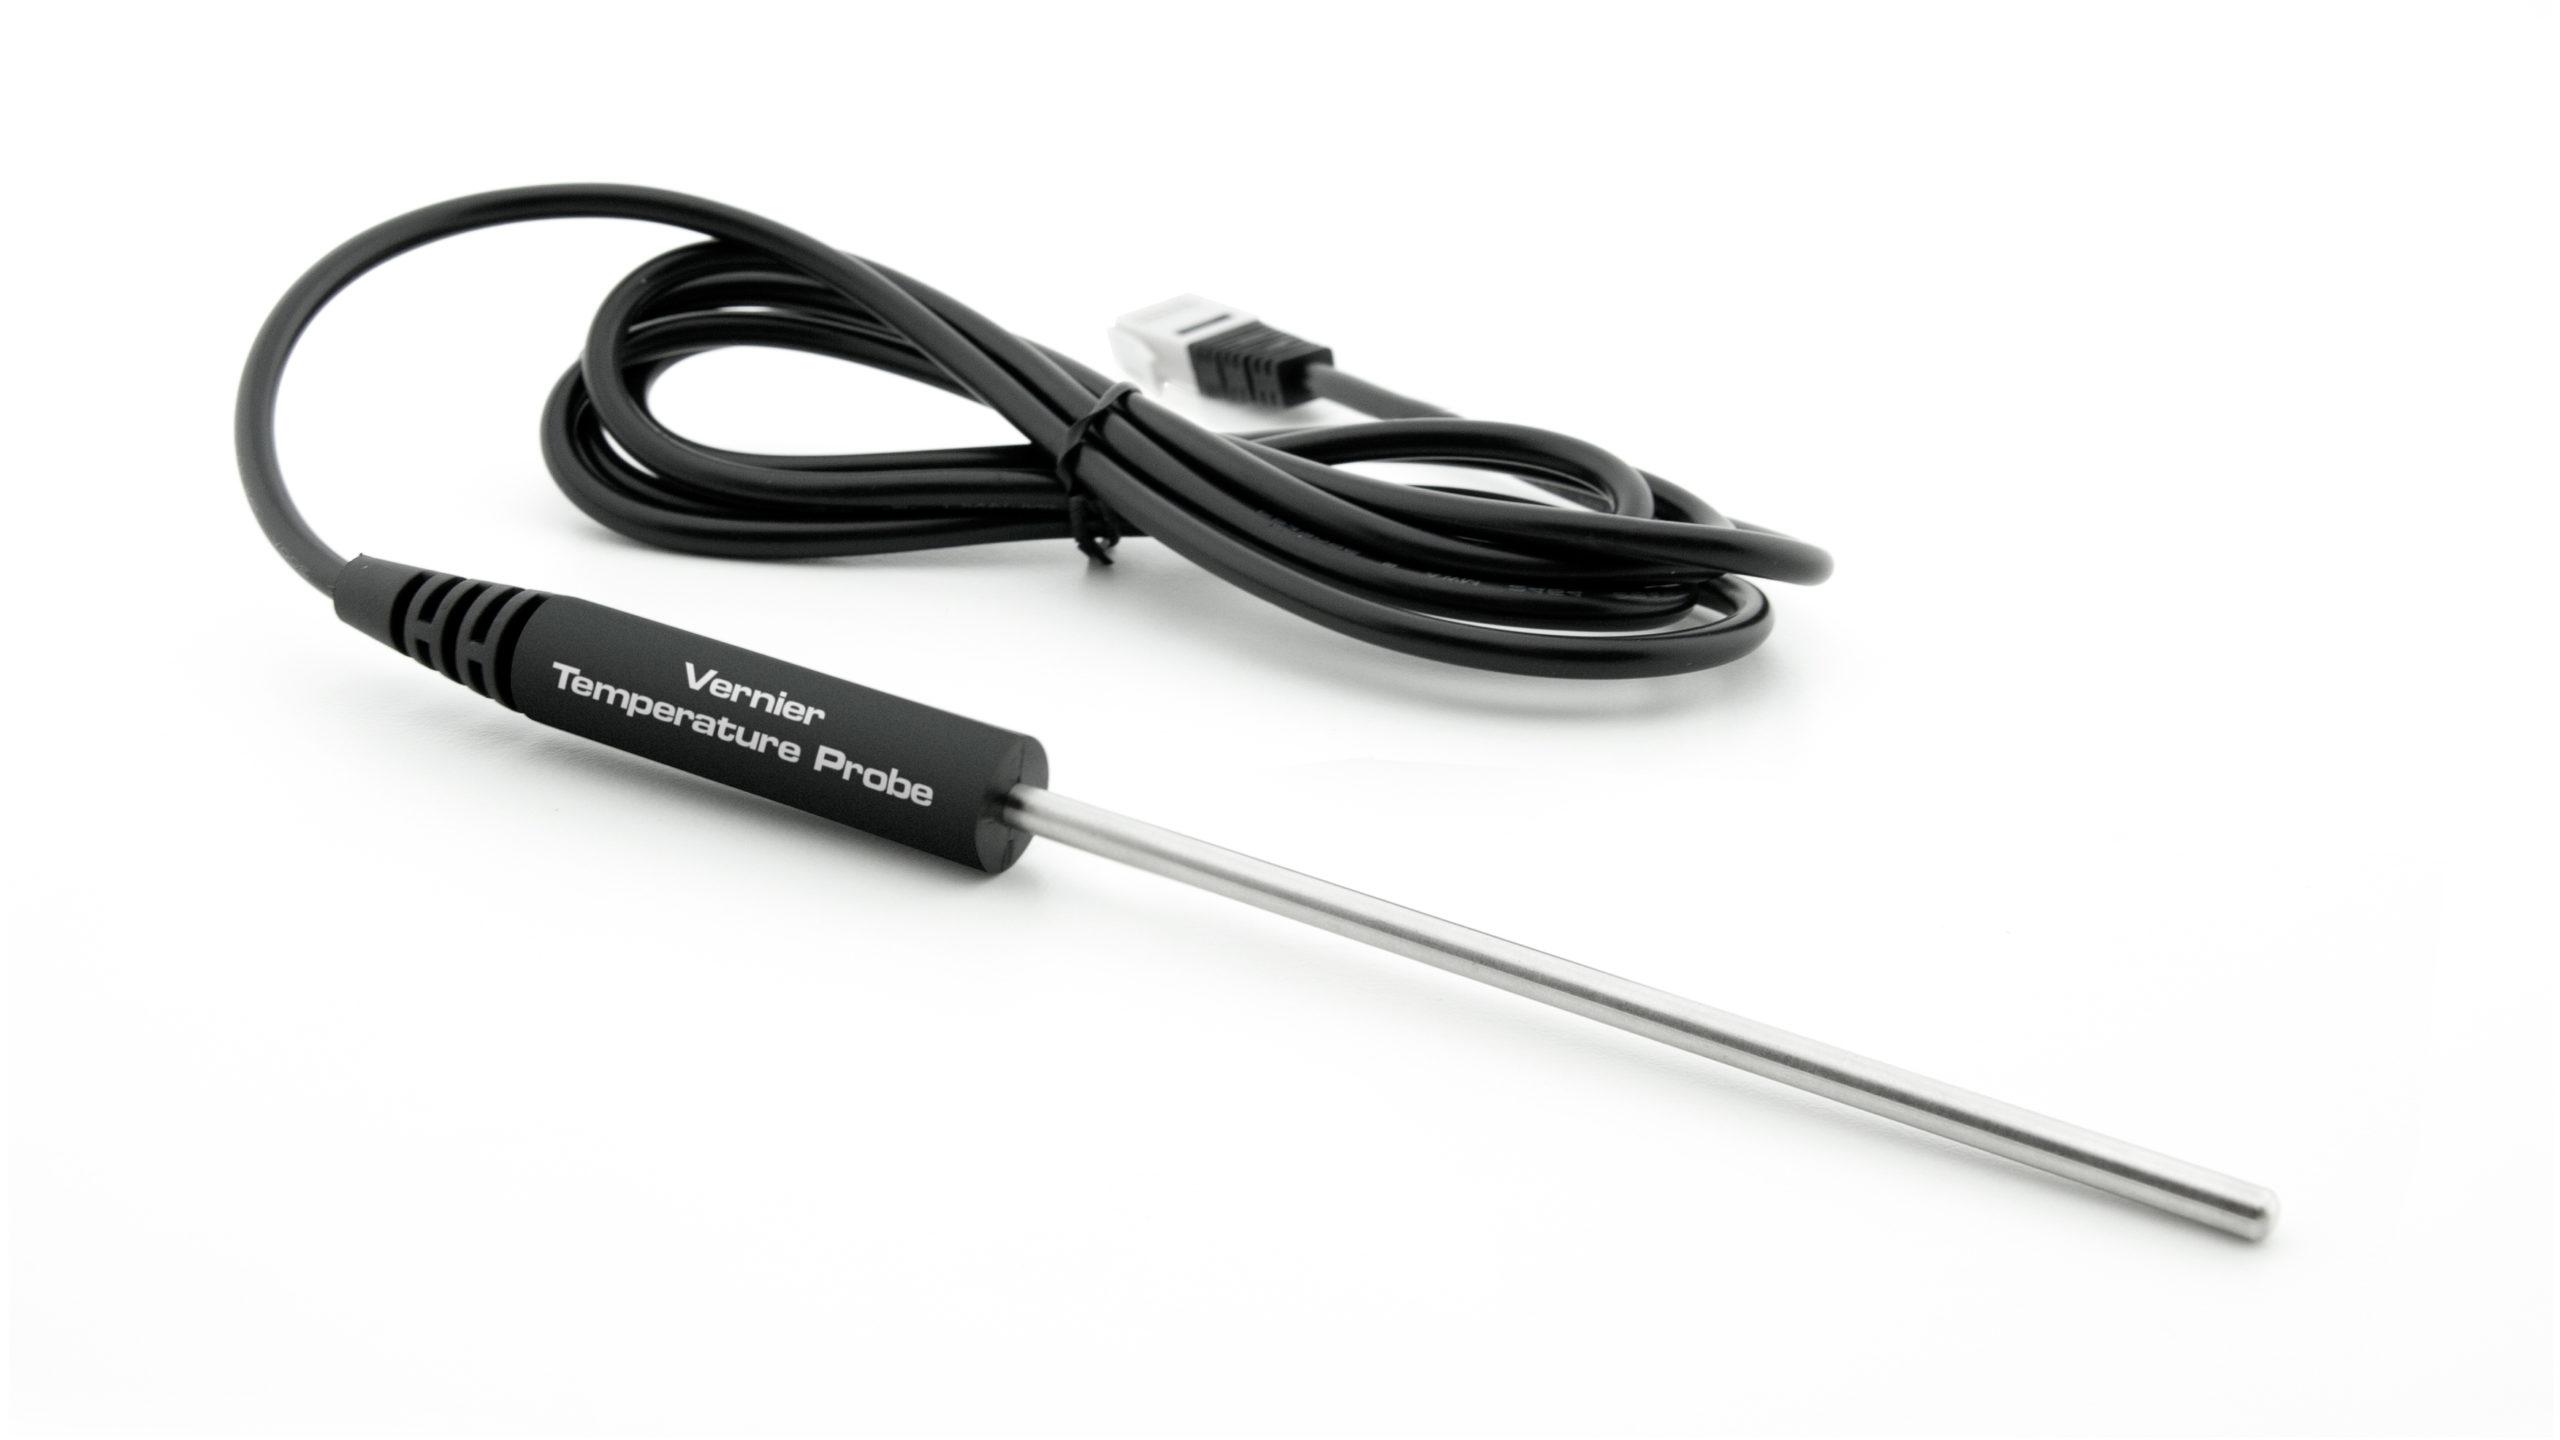
Sensors and Equipment
This experiment features the following sensors and equipment. Additional equipment may be required.
Ready to Experiment?
Ask an Expert
Get answers to your questions about how to teach this experiment with our support team.
- Call toll-free: 888-837-6437
- Chat with Us
- Email support@vernier.com
Purchase the Lab Book
This experiment is #4 of Advanced Physics with Vernier — Beyond Mechanics. The experiment in the book includes student instructions as well as instructor information for set up, helpful hints, and sample graphs and data.

