Introduction
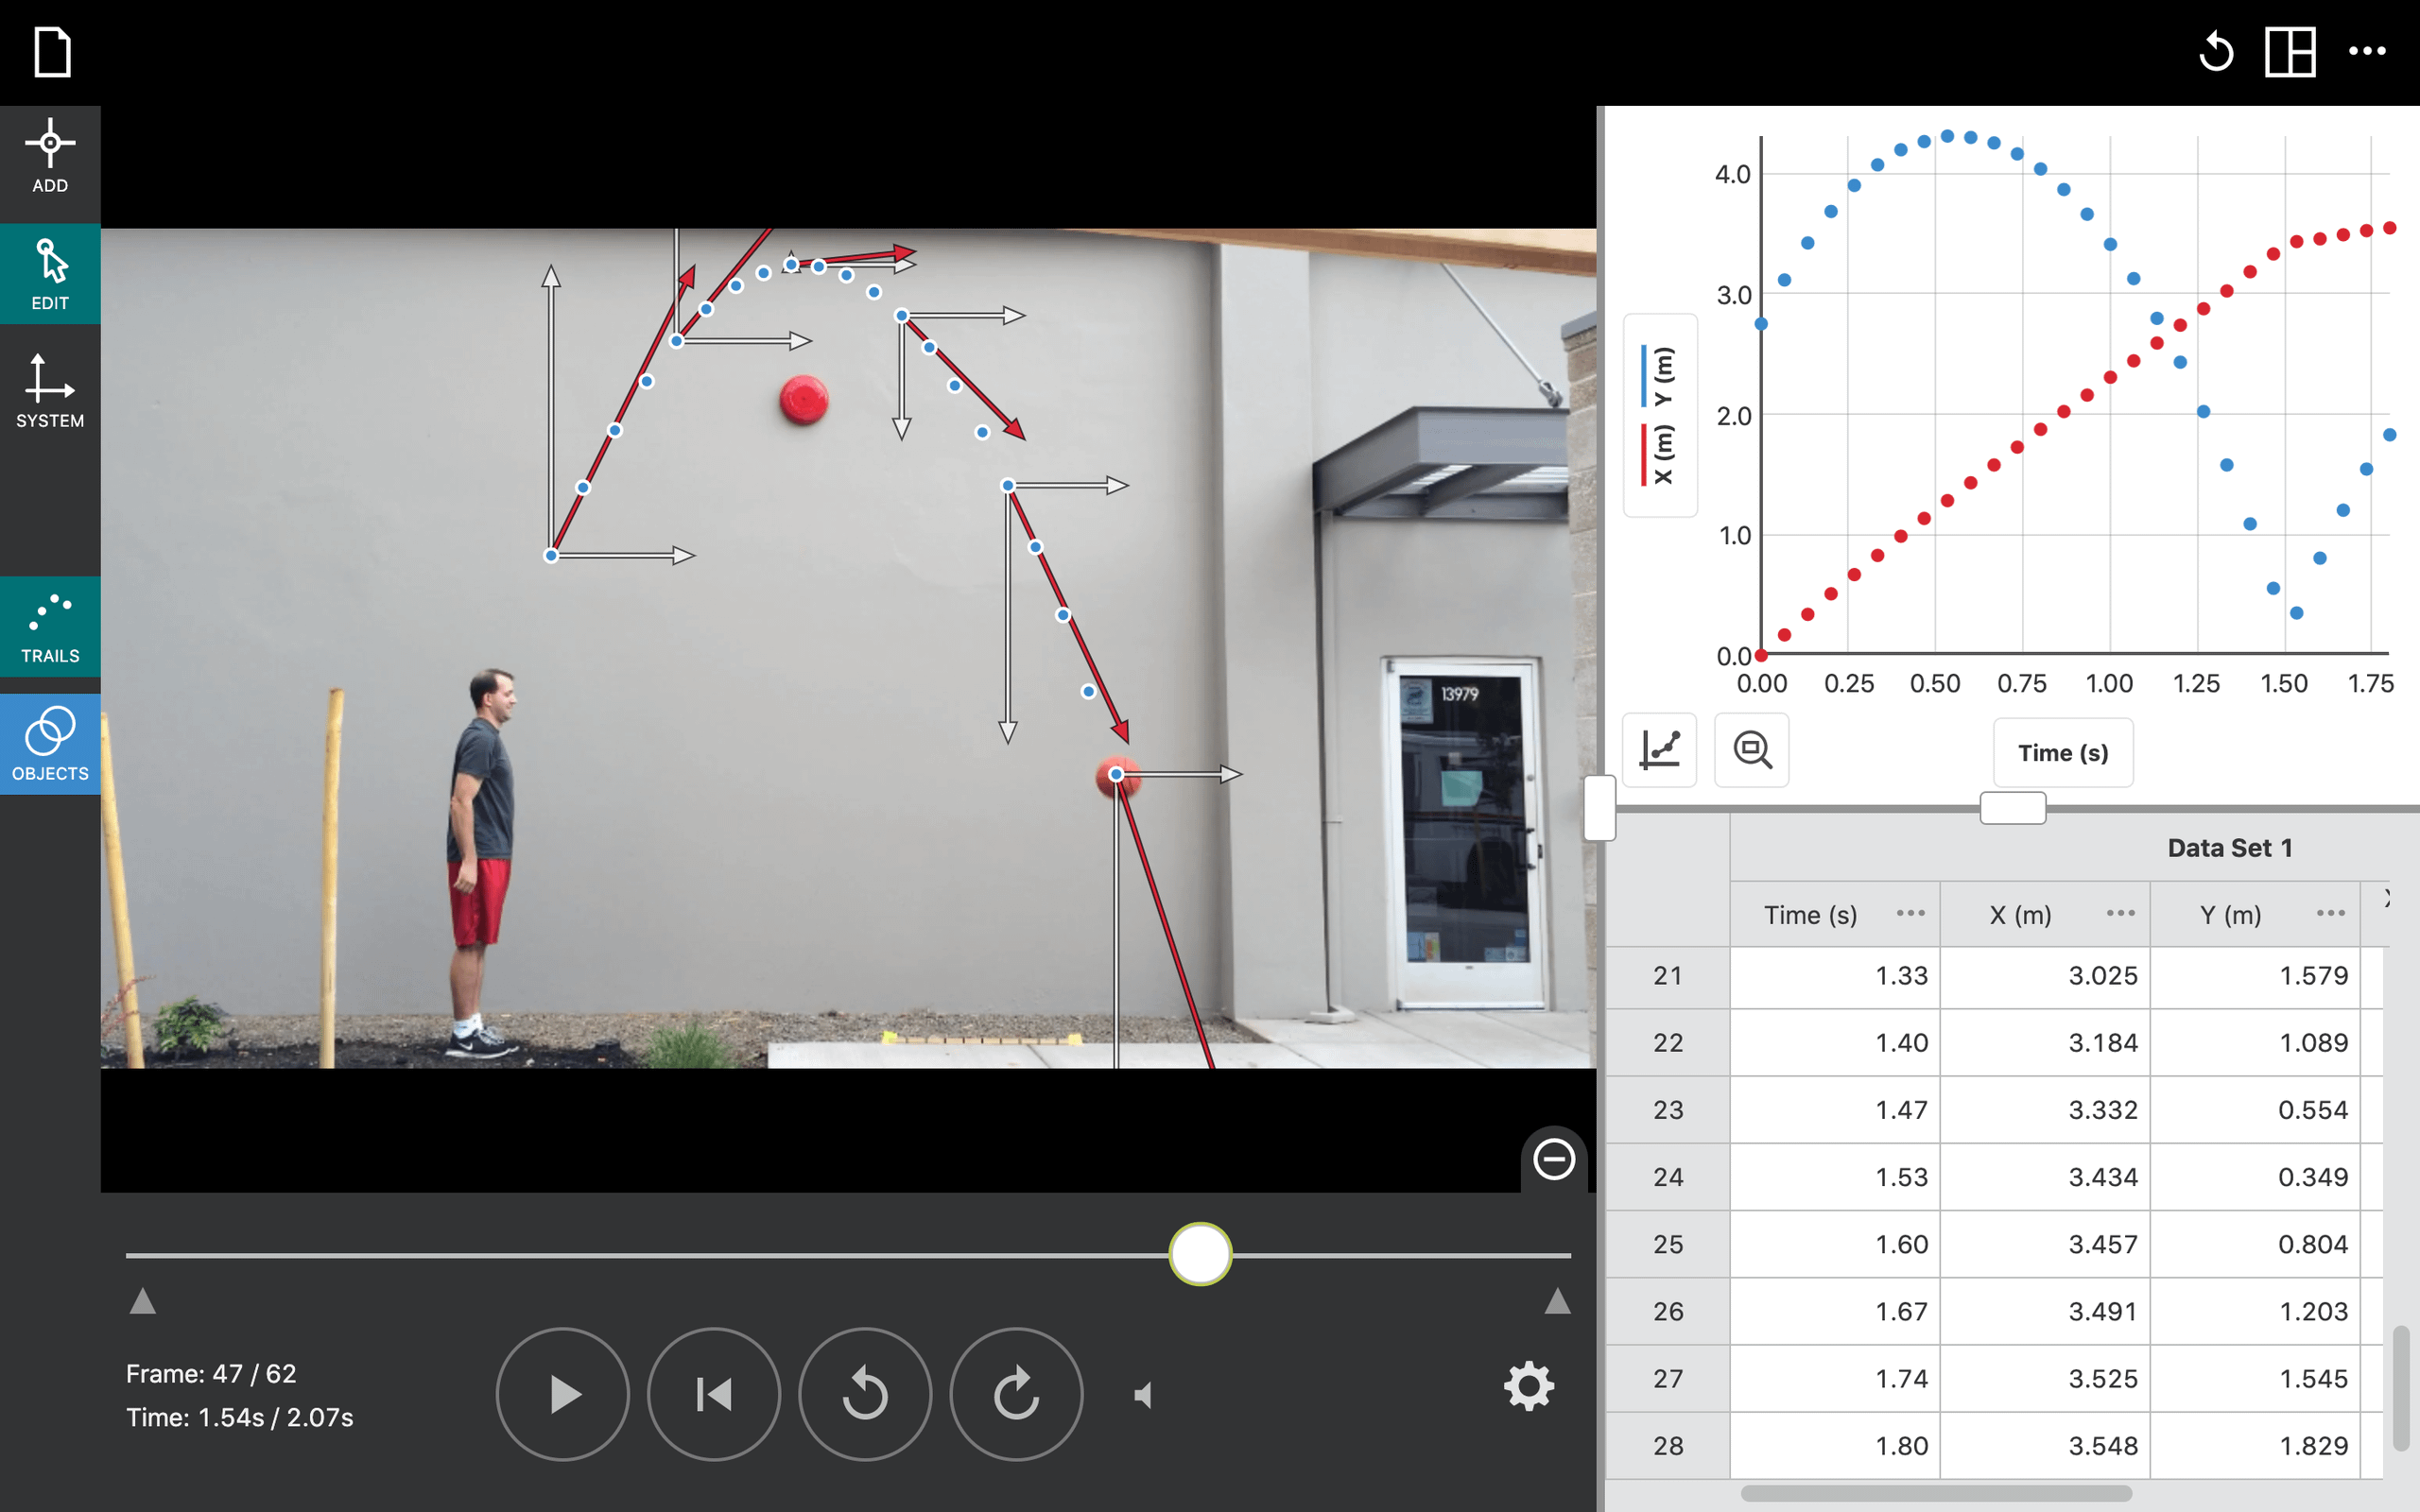
How can we use mathematics to express the way an object moves when it is speeding up? The velocity of the object is constantly changing, rather than a steady value. In this exercise, you will apply curve fits to graphs of position vs. time and velocity vs. time for a fan cart. You will use the curve fits to determine the parameters of the motion.
Objectives
In this experiment, you will
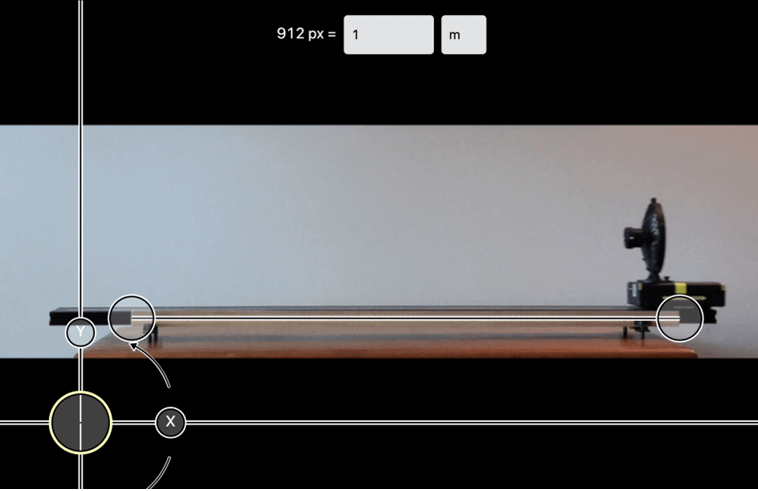
- Use video analysis techniques to obtain position, velocity, and time data for a cart that is speeding up.
- Apply curve fits to your graphs to determine how to mathematically describe the motion.
- [Extension] Analyze an additional video of an object undergoing constant acceleration.
Sensors and Equipment
This experiment features the following sensors and equipment. Additional equipment may be required.
Ready to Experiment?
Ask an Expert
Get answers to your questions about how to teach this experiment with our support team.
- Call toll-free: 888-837-6437
- Chat with Us
- Email support@vernier.com
Purchase the Lab Book
This experiment is #2 of Vernier Video Analysis: Motion and Sports. The experiment in the book includes student instructions as well as instructor information for set up, helpful hints, and sample graphs and data.


