Sharing ideas and inspiration for engagement, inclusion, and excellence in STEM

The periodic table has been an essential tool for teachers and students since its creation in 1869 by Dmitri Mendeleev. Now 150 years later, 2019 has been designated the International Year of the Periodic Table. With all the information that can be gleaned from the periodic table, chemistry instructors face the challenge of helping students understand the significance of the different arrangements.
One concept commonly taught when covering elements with your students is the periodic trends of different elemental properties, which is made evident by the arrangement of the elements in specific families and series.
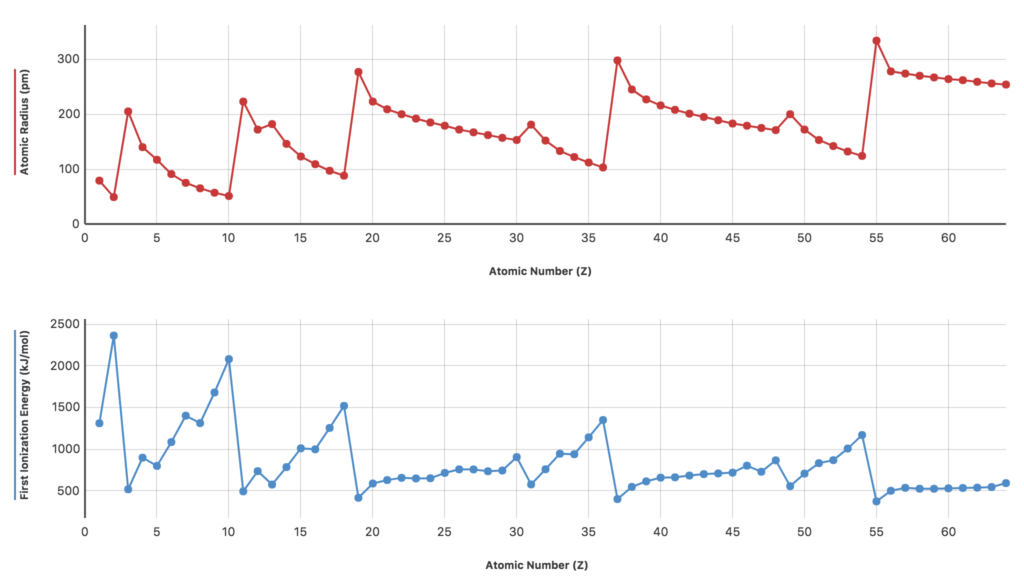
Prior to my role as a chemistry education specialist at Vernier, I taught chemistry and physics in Frederick County, Maryland, for 34 years. The most common trends to study on the periodic table are the relationship of atomic radius to atomic number and first ionization energy to atomic number. These properties are related, but the relationship between them is not immediately obvious to students and can be a challenge to teach to them. This relationship is fundamental to the chemical behavior of elements across a series on the table and also to elements within each family. Good understanding of these properties leads to better comprehension of electron configuration, ionic bonding, and photoelectron spectroscopy—a free response question topic on the 2019 AP Chemistry exam.
Investigate Periodic Trends Even Further with Free Software
You can easily compare properties of elements using the free Graphical Analysis™ 4 app from Vernier Software & Technology, available for Chromebooks, computers, and mobile devices. By graphing changes within families or groups of elements, students can make conclusions about how properties are periodic and how one property can affect another.
We have created a file containing data from the properties of elements in the periodic table. Once downloaded, students can simply launch Graphical Analysis 4 on their devices and open the file. Now, compiling lists of peak atomic radii and first ionization energies becomes much easier.

Students can easily manipulate the axes on the graphs and work on activities such as the following:
- Make a list of all the elements, including their atomic numbers, that have peak atomic radii. Compare your list to the periodic table.
- Make a list of all the elements, including their atomic numbers, that have the lowest repeating atomic radii. Compare your list to the periodic table.
- Make a list of all the elements, including their atomic numbers, that have the peak first ionization energies. Compare your list to the periodic table.
- Make a list of all the elements, including their atomic numbers, that have the lowest repeating first ionization energies. Compare your list to the periodic table.
- What can you say about your lists from the graphs and elements in families on the periodic table? Why do the same elements and families keep appearing on the lists of maximum and minimum atomic radius and ionization energy?
Take this one step further by challenging your students to investigate additional periodic trends. By tapping or clicking on the axes labels, students can change what is plotted on the axes. Additional challenges might include
- Compare the shapes of the graph regions of atomic radius and first ionization energy for elements 20 through 30 in the graphs above. Why do you think these properties are not changing as much for these elements as they are for other elements in the graph?
- Work out the electron configurations for elements 29, 30, and 31.
- Look at the shape of the graph region of atomic radius and first ionization energy for these elements.
- In terms of electron configuration, explain the reversed shapes of the graphs for these three elements. You may need to think about how the electron configurations may vary from the Aufbau principle.
Use LabQuest 2 to Investigate Periodic Trends
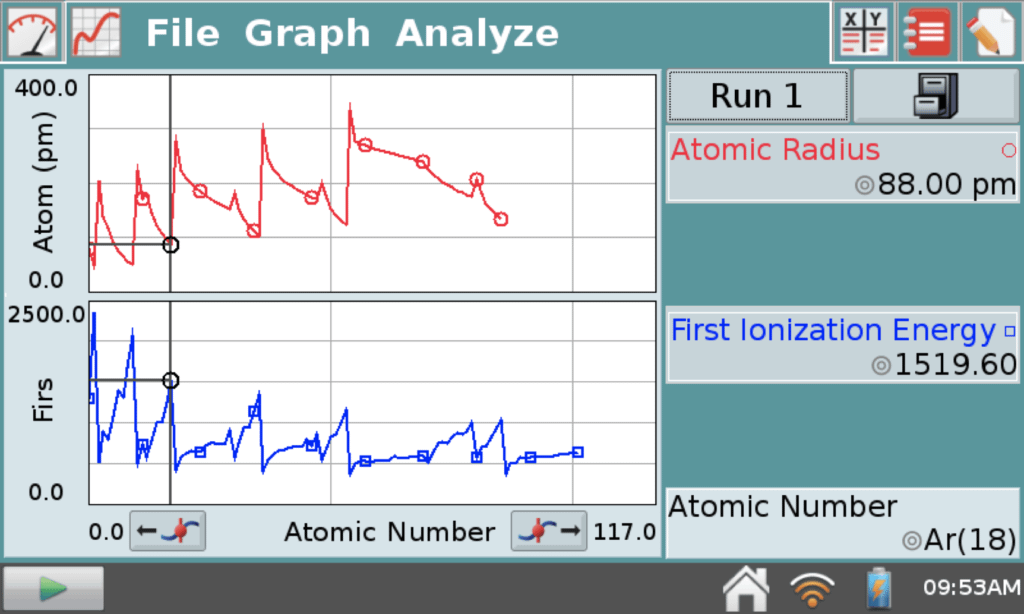
While there are several ways to demonstrate this concept, another tool that proved especially useful for me while I was teaching was the data file for investigating periodic trends that is stored on the Vernier LabQuest® 2 interface. LabQuest 2 is our standalone device used to collect sensor data with its built-in graphing and analysis application, LabQuest App.
From the File menu of LabQuest App, open the file named periodic_table_data.qmbl. With this file, students can quickly plot various properties of elements against atomic number. There are a number of periodic trends that can be explored using this file, including discussion of d orbitals and their effect on radius and ionization energy, among others.

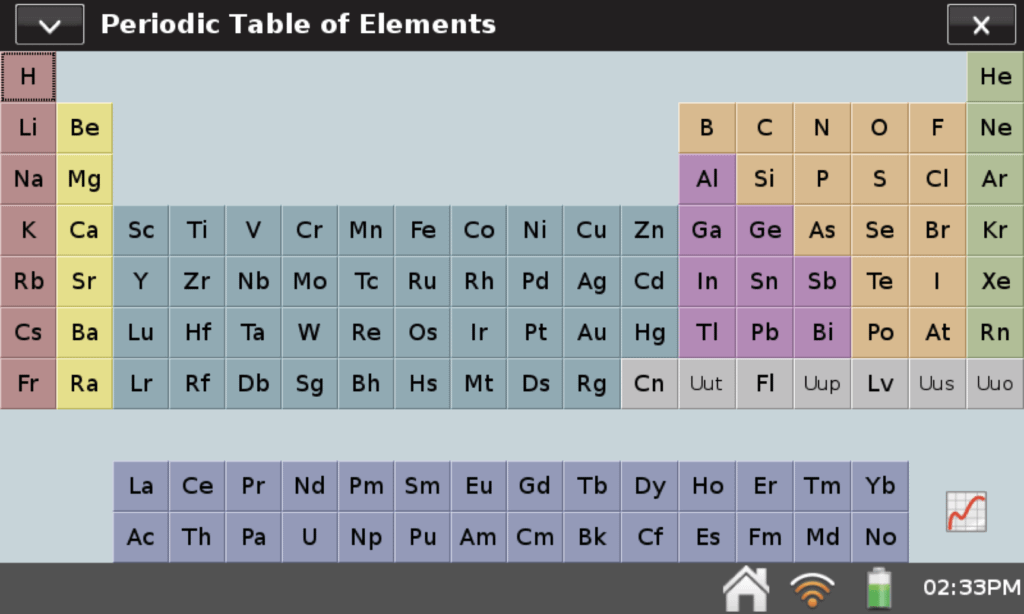
Another helpful feature on LabQuest 2 is the Periodic Table app. With this app, students have instant access to a periodic table anytime they need it. If you are not familiar with the app, just click or tap on the Home icon at the bottom of the LabQuest screen and select the Periodic Table app to get started. Click or tap on any of the elements displayed, and you will find a wealth of information about that element.

Do you want to take these experiment ideas even further? At Vernier, our durable hardware and quality software are designed and priced for hands-on student use and learning, and our data-collection technology is so versatile that it can be used in nearly all scientific disciplines. If you have a specific subject, project, or need in mind, let us know, and we’ll happily talk with you about how our technology may benefit your lab.
Share this Article

Sign up for our newsletter
Stay in the loop! Beyond Measure delivers monthly updates on the latest news, ideas, and STEM resources from Vernier.


