Sharing ideas and inspiration for engagement, inclusion, and excellence in STEM
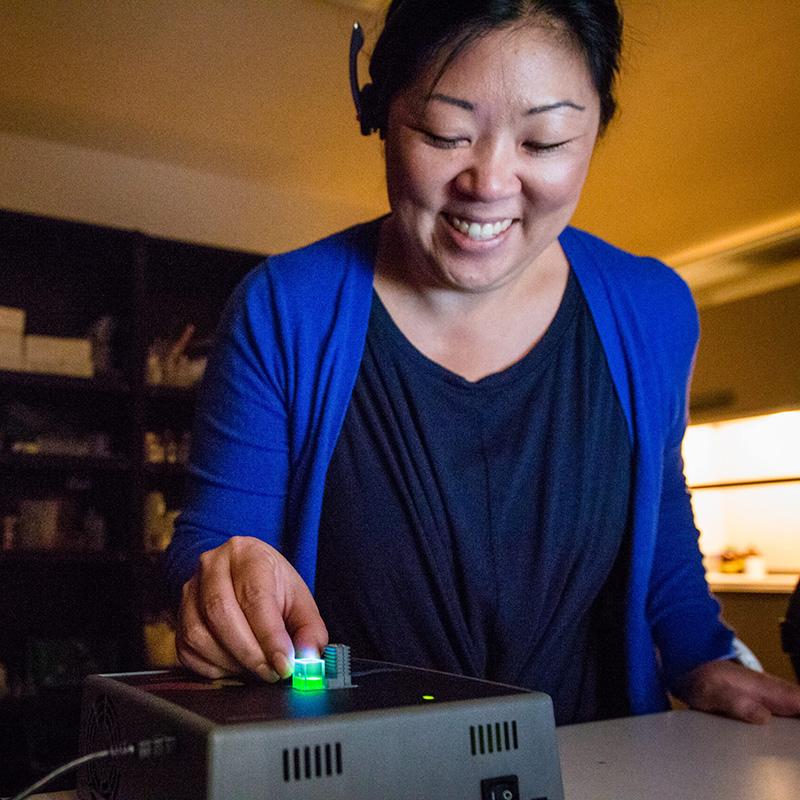
Fluorescence spectroscopy is a very sensitive and delicate technique. It often requires a few attempts before getting great data. In our chemistry department, we have come across a few common problems and would like to share some solutions that fix or avoid them.
While these helpful tips are designed for improving your Vernier Fluorescence/UV-VIS Spectrophotometer data, the majority of them can be used with any combination fluorescence/absorbance spectrometer.
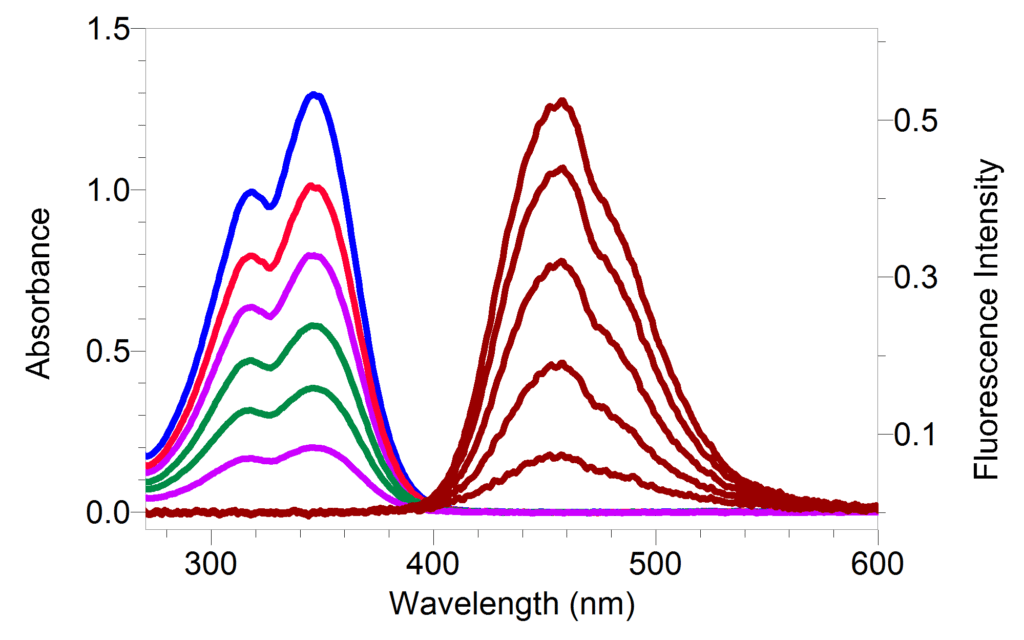
- Collect an absorbance spectrum of your sample first. This will help you decide which excitation wavelength will work the best for your application. It will also help you narrow down the concentration of your sample for fluorescence measurements.
- If the absorbance reading where you plan to excite it is greater than 0.1 absorbance units, dilute your sample until it is around 0.1. Fluorescence is a very sensitive technique and requires samples to be more dilute than absorbance measurements. If samples are too concentrated, you may see low fluorescence emission peaks and/or distorted band shapes. This is due to the inner filter effect which is the reabsorption of emitted radiation.
- Try different sample time/integration times. The sample time is the time that the individual diodes (pixels) in the array are allowed to respond to light before they are “read out” and reset to zero. They respond linearly to light until they approach saturation. When students increase and decrease this value, the signal will get larger and smaller proportionally. In Logger Pro, you can adjust this value during live data collection to see the result.
- Change the LED Intensity. This is similar to adjusting the slit width in a typical fluorescence spectrometer. Increasing the intensity should increase the signal.
- Change the Samples to Average. This command sets the number of discrete spectral acquisitions that are accumulated before a spectrum is displayed. The higher the value, the better the signal to noise ratio. The drawback here is that the more samples your students are averaging, the longer they are going to have to wait for a stable spectrum.
- Make sure you are using Logger Pro 3.15 or newer, or LabQuest 2.4.2 or newer. In older versions, you are forced to calibrate in fluorescence mode. There is a bug during fluorescence calibration that does not honor the sample time you typed in before the calibration. This will cause spectra to look much smaller than you may anticipate. If you chose to calibrate even in later versions, you will see this bug; the short-term fix is to change the sample time after calibration.
To get acquainted with the Vernier Fluorescence/UV-VIS Spectrophotometer software and instrument, we suggest following the free lab instructions for “A Guided Inquiry Approach to Understanding Fluorescence Spectroscopy“.
The experiment walks through a lot of common sticking points and really helps students understand what they are looking at when taking fluorescence data.
Want to see more? I will be showing off the Vernier Fluorescence/UV-VIS Spectrophotometer at the Fall Regional ACS shows (MWRM, SERMACS, and SWRM) as well as at WCCTA. See a full list of the college chemistry conferences we attend »
Share this Article

Sign up for our newsletter
Stay in the loop! Beyond Measure delivers monthly updates on the latest news, ideas, and STEM resources from Vernier.


