Sharing ideas and inspiration for engagement, inclusion, and excellence in STEM
From supporting aquatic life to maintaining a balanced ecosystem, dissolved oxygen (DO) is a critical component of a healthy aquatic environment—whether it is an ocean, river, pond, or local watershed. To help students understand exactly what DO is and how it impacts waterways, you can incorporate a hands-on experiment into your biology or environmental science lessons. This can help students meaningfully connect what they are learning with the world around them.
What Is Dissolved Oxygen?
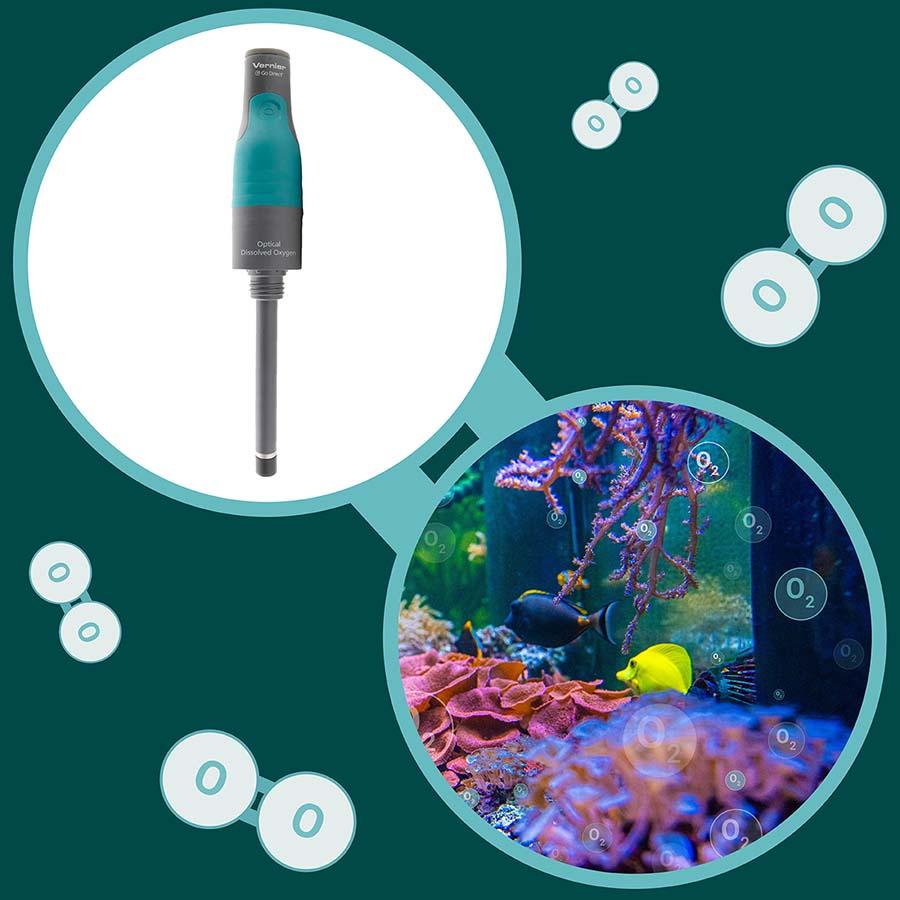
Dissolved oxygen can be a challenging concept for students to grasp because they commonly think of it as the oxygen found in a water molecule (H2O). Almost all aquatic organisms need oxygen to survive, but the oxygen atom bound in a water molecule is not accessible for respiration. In actuality, organisms like fish breathe the same molecular oxygen (O2) that humans do! When this oxygen is dissolved in water, we refer to it as DO, and it is measured in milligrams per liter (mg/L).
Dissolved oxygen enters water through two main processes:
- Photosynthesis: Just like terrestrial plants, aquatic plants and algae also produce oxygen.
- Diffusion: Oxygen also enters water when its surface is agitated by natural movements, like waterfalls, rapids, or ripples—or by manual stirring or shaking.
Several factors can influence DO levels in water, including salinity, atmospheric pressure, and water temperature. In this experiment, we’ll focus on investigating the relationship between temperature and dissolved oxygen.
Why Is Dissolved Oxygen Important?
Dissolved oxygen is vital to the health of aquatic life. Heterotrophic organisms, such as fish, shellfish, and zooplankton all need oxygen in water to thrive, just as humans do above water. When there isn’t enough dissolved oxygen in a watershed, this can create a dead zone, a hypoxic area that can’t support marine life.
As a result, fish either die off or migrate to areas with more oxygen. The types of fish that can live in these areas may also change. For instance, trout and salmon need higher DO levels, while catfish and carp can survive with less. Warmer water temperatures can also increase decomposition rates, further depleting oxygen and leading to even more stress on aquatic life.

A Hands-On Experiment to Investigate How Water Temperature Affects Aquatic Life
In this experiment, “Dissolved Oxygen in Water” from Biology with Vernier, students focus on the relationship between water temperature and the amount of dissolved oxygen in water.
Students will measure the concentration of dissolved oxygen in various water samples using the Go Direct® Optical Dissolved Oxygen Probe and Vernier Graphical Analysis® to determine the effect of temperature on the amount of dissolved oxygen in water and predict the effect of water temperature on aquatic life.
While this experiment is conducted in a lab, the waterproof Go Direct Optical Dissolved Oxygen Probe can also be used in the field to measure the water quality of both fresh and saltwater samples. You can also take samples from a classroom aquarium or campus watershed if one is easily available to compare to your experiment data!
Essentials for this Experiment
- Chromebook™, computer, or mobile device
- Vernier Graphical Analysis app
- Go Direct Optical Dissolved Oxygen Probe
- 250 mL beakers (2)
- 100 mL beaker
- Polystyrene foam cup
- One-gallon container with lid (such as a milk container)
- Hot and cold water
- Ice
The Setup
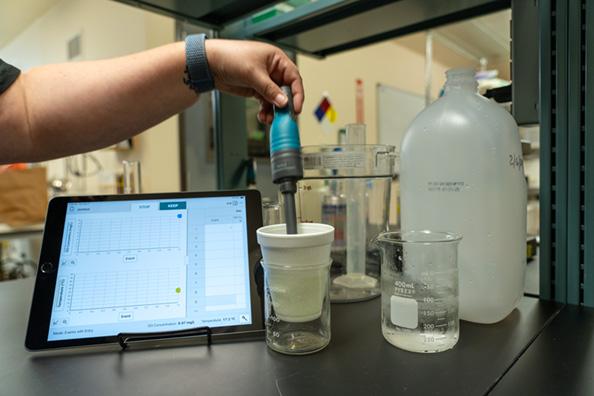
Set up your experiment near a sink with access to both hot and cold taps. Fill one of the two 250 mL beakers with ice and cold water.
Place the foam cup inside the second 250 mL beaker, which will be used to insulate each water sample. Keeping the foam cup in the beaker will stabilize the cup, preventing it from tipping over while the probe collects data.
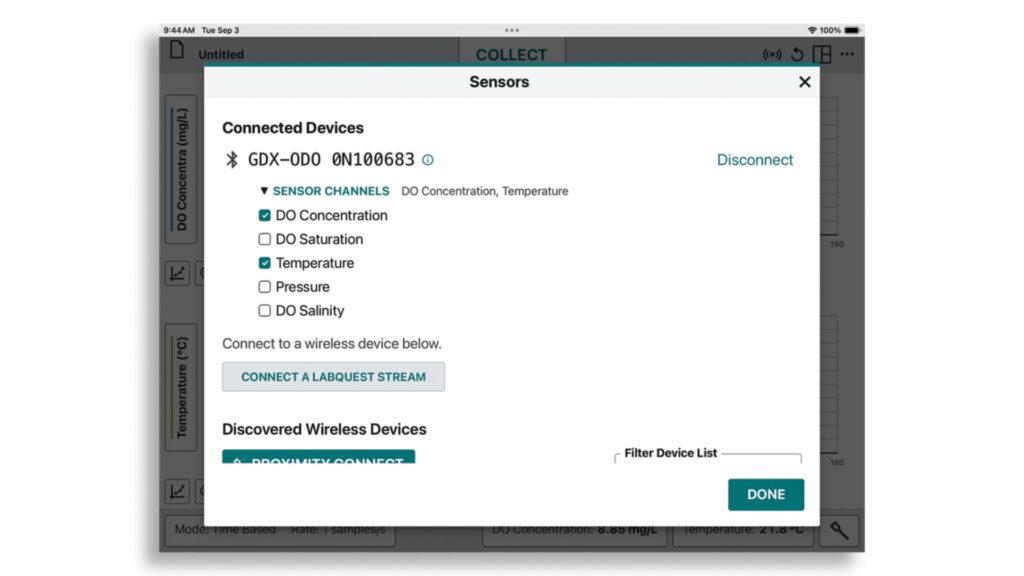
Launch Graphical Analysis and identify your Go Direct Optical Dissolved Oxygen Probe via Bluetooth® wireless technology or USB. On the Sensors screen, make sure to select both DO Concentration and Temperature sensor channels. Then, tap or click Done to connect.
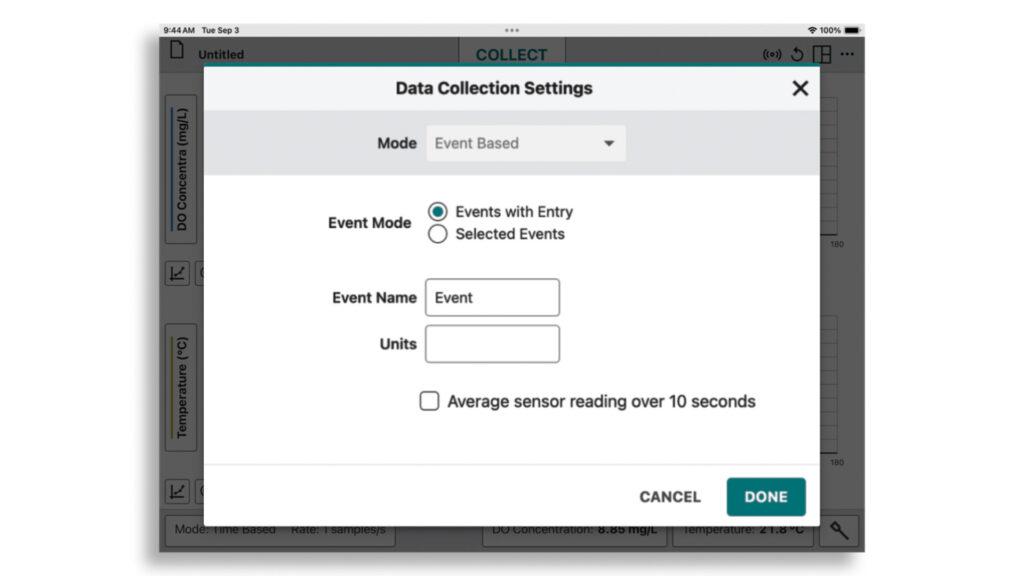
Once your sensor is connected, update the data-collection mode in the bottom left-hand corner to “Event Based” and “Events with Entry.” Tap or click Done.
Conducting the Experiment
Encourage students to make predictions about what they expect to see when they vary the water temperature based on introductory classroom conversations before beginning the following steps.
Cold Water
Pour approximately 100 mL of cold water and small pieces of ice from the beaker into the empty one-gallon container and seal with the lid. Shake vigorously for two minutes.
Note: Shaking the samples allows the air inside the container to dissolve into the water and is essential to producing sound data. It’s important to understand that temperature affects the water’s capacity to hold dissolved oxygen, rather than directly increasing or decreasing current oxygen saturation. Heating or cooling the water alone will not change the DO level. Once we agitate the sample at the new temperature, we can then see the result of that changed capacity through the DO data.
After two minutes of shaking, pour the water from the container into the foam cup and insert the Go Direct Optical Dissolved Oxygen Probe into the sample. Allow 90 to 120 seconds for the meter readings to stabilize and select Keep in Graphical Analysis to record the data.
Pour the water from the foam cup back into the container, reseal, and shake the container vigorously again for one minute. The friction from shaking, plus heat from handling the container, will slowly begin to raise the water temperature. Pour the water back into the foam cup, wait for the data to stabilize, select Keep, and pour the water sample back into the container.
Repeat this process until the water sample reaches room temperature (about 25°C). This usually takes between four and six events but can vary depending on time, ambient temperature, and other factors. The most important thing is that we are seeing changes in the temperature and DO readings.
Hot Water
Next, pour out 50 mL of the cold water and add 50 mL of hot water from the tap (about 30–40°C). Pour the new sample into the container and shake it for another minute. Pour the agitated sample back into the foam cup, wait for the data to stabilize, and select Keep. As with the cold water steps, repeat this shaking and data-collection process until the water temperature decreases to reach room temperature.
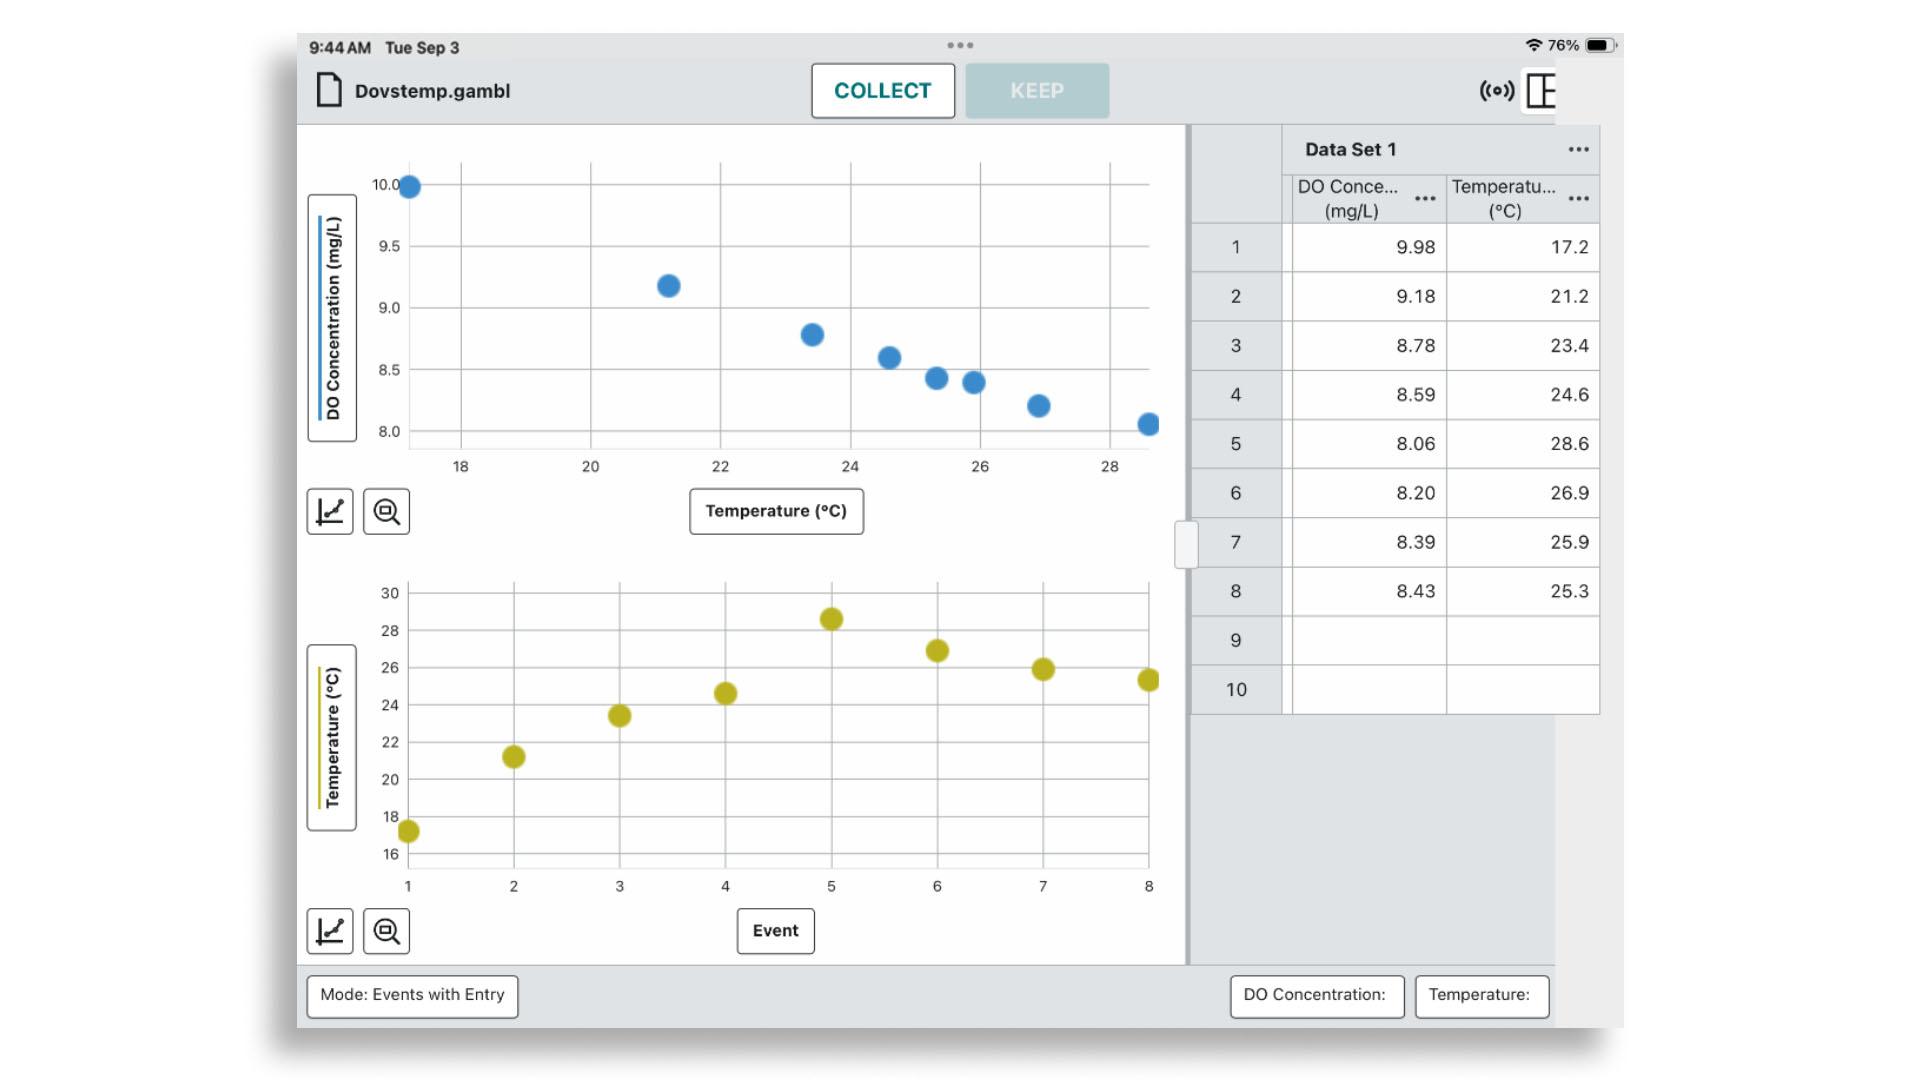
In Graphical Analysis, students can observe distinct data points showing how dissolved oxygen levels change with rising or falling water temperatures.
Data Analysis
When all the data samples have been taken, students can use Graphical Analysis to create a single dissolved oxygen vs. temperature graph and analyze their results—both individually and as part of a broader class discussion.
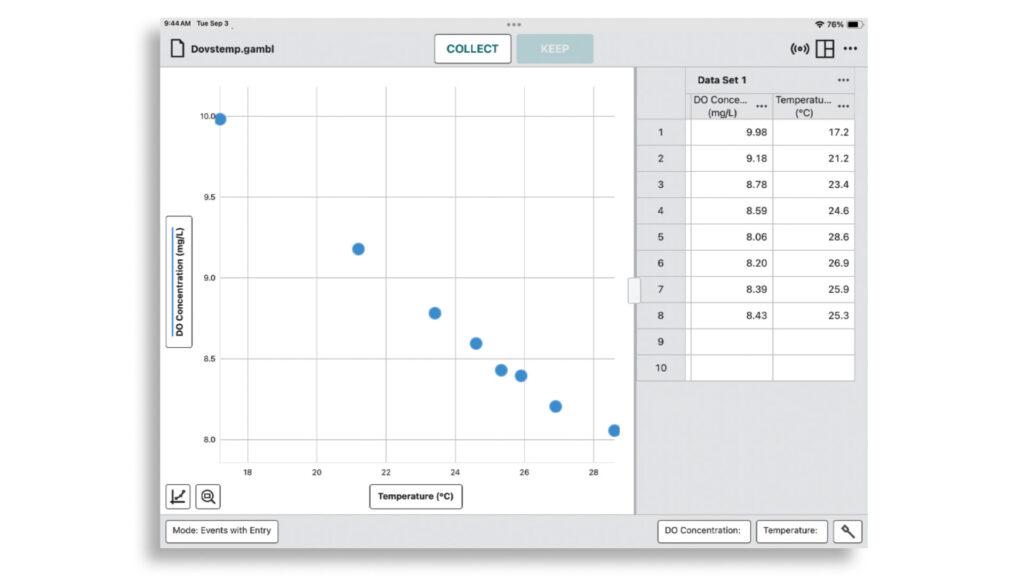
Students should be able to visualize the inverse relationship between temperature and dissolved oxygen in Graphical Analysis.
Experiment Tips
- Allot one 45-minute class period to conduct this experiment.
- Collect a minimum of 6–8 data points for best results.
- For more advanced students, consider introducing DO saturation, using additional sensor channels in the Go Direct Optical Dissolved Oxygen Probe.
Discussion Questions
Following the experiment, discuss students’ findings and observations as they relate to supporting healthy aquatic environments.
- At what temperature was the dissolved oxygen concentration the highest? Lowest? Does the data indicate how the amount of dissolved oxygen in the water is affected by the temperature of water?
- What might cause dissolved oxygen levels to drop in a body of water? Consider both natural factors and human activities that could contribute to this change.
- Why might trout be found in pools of water shaded by trees and shrubs more commonly than in water where the trees have been cleared?
- Consider local bodies of water in your communities. What kind of marine life have you observed there? What kind of environmental factors contribute to the health (or absence) of marine life you are seeing?
- How does the presence of dead zones in places like the Chesapeake Bay affect local communities, both environmentally and economically? What kind of strategies or solutions can we explore to help mitigate these problems?
Looking for more? Check out our Aquatic Animal Health and Dissolved Oxygen webinar to see Vernier biology and environmental science specialist Colleen McDaniel walk through this experiment. You can also read check our recent blog post for more helpful tips and best practices for getting the best dissolved oxygen data using Vernier sensors.
Questions? We’re always here to help! Reach out to biology@vernier.com or call 888-837-6437.
Share this Article
Related Articles


Sign up for our newsletter
Stay in the loop! Beyond Measure delivers monthly updates on the latest news, ideas, and STEM resources from Vernier.