Sharing ideas and inspiration for engagement, inclusion, and excellence in STEM

Whether studying CO2 changes during photosynthesis or investigating the conservation of momentum during a collision, students need to be able to do more than just plot points on a graph—they need to understand the story that a graph tells. One incredibly effective way to develop this kind of data literacy is to incorporate data-collection technology and investigations into your instruction. Real-time data collection not only helps students build stronger connections between abstract scientific concepts and the real world but also helps students transform raw data into meaningful insights through tabulation, graphs, visualization, and statistical analysis.
Ready to get started? Check out our recommendations for the best sensors and experiments to introduce your students to data collection at all levels. By developing core skills in data analysis and interpretation, students can more effectively engage in sensemaking, visualize information, identify patterns, draw meaningful conclusions, and communicate their findings.
Best Sensors to Introduce Data Collection
Looking for the right tools to get started? These are some of our most versatile and easy-to-use sensors that effectively introduce students to data collection and analysis, and can be used in many experiments moving forward.
For Chemistry, Biology, and General Science
- Go Direct® Temperature Probe: Ideal for beginners because students can tangibly feel temperature differences when measuring things like body heat or hot water, making it easier to understand and relate data to graphs.
- Go Direct Gas Pressure Sensor: Great for a wide range of applications, including Boyle’s law in chemistry and transpiration in biology.
For Physics, Physical Science, and General Science
- Go Direct Motion Detector: Ideal for introducing motion data collection because students can use their own body movement to generate graphs.
- Go Direct Force and Acceleration Sensor: Excellent for exploring Newton’s second and third laws, this sensor helps beginners measure and understand force and acceleration in a hands-on way.
Supporting Students with Software Tools
Vernier Graphical Analysis® Pro
- For Beginners: Helps students to interpret graphs by allowing them to easily visualize data they’ve collected from Vernier sensors in real time. This hands-on approach makes it easier for students to understand the graphs as they are directly connected to the phenomena they have observed.
- For Advanced Learners: Enables students to experiment with different presentation styles (e.g., bar graphs vs. line graphs) for optimal clarity. Advanced users can also perform calculations based on their data and graph the results for further analysis.
- For Beginners: Introduces physics students to video analysis by helping them track and plot data from physical events, bringing abstract concepts to life.
- For Advanced Learners: Allows for detailed data analysis and manipulation, enabling advanced learners to delve deeper into motion concepts and advanced calculations.
Three Introductory Activities for Data Collection at All Grade Levels
1. Graph Matching
Included in Physics with Vernier, Middle School Science with Vernier, and Physical Science with Vernier
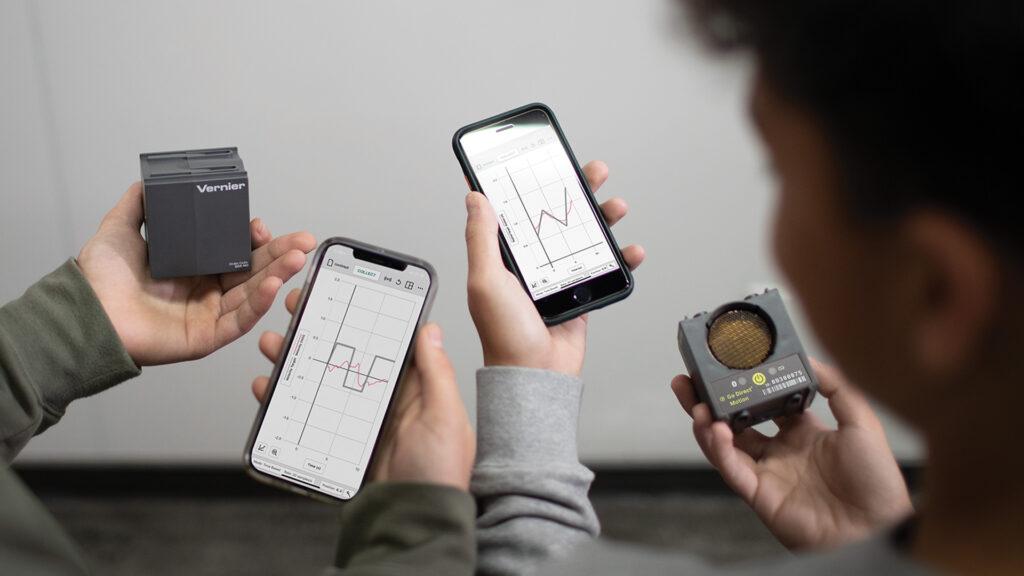
This investigation uses a motion detector and Vernier Graphical Analysis to plot real-time graphs of students’ movement as they walk around the classroom. Many students struggle to understand the story a graph tells. They might wonder: What data do the points or lines represent? Which direction is positive or negative? How is speed represented?
Graph matching is an excellent activity to begin with because students use their bodies to “draw” the data on the graph. This physical interaction helps them intuitively understand how their movements translate to graphical representations. It’s also a fun activity to start the year —it gets students up and active, can be a fun competition, and helps them connect their real-world movements to graph visualization. This activity can be used with students from K–12 through college and in any subject area as an introduction to data collection and graph analysis.
2. Introduction to Data Collection
Included in Earth Science with Vernier and Agricultural Science with Vernier
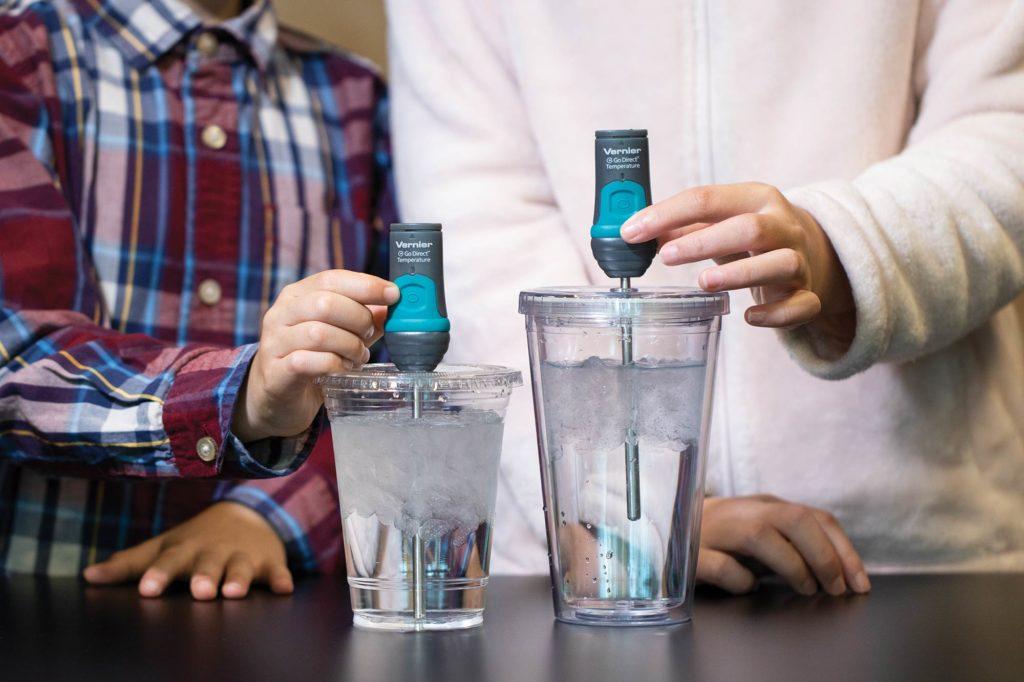
This practical activity introduces students to two of the most common modes of data collection in Graphical Analysis: time-based and event-based. Students start by using a temperature probe to record the temperature of water over time, learning how to plot continuous data on a graph. Next, students use event-based data collection to graph the hand temperature of individual students. This method helps them understand how to record and compare discrete data points.
This is an easy, simple tutorial that familiarizes students with the graphing software and illustrates the versatility of data collection methods. By practicing both time-based and event-based data collection, students gain hands-on experience and a solid foundation for more complex investigations.
3. Projectile Motion
Included in Vernier Video Analysis: Motion and Sports
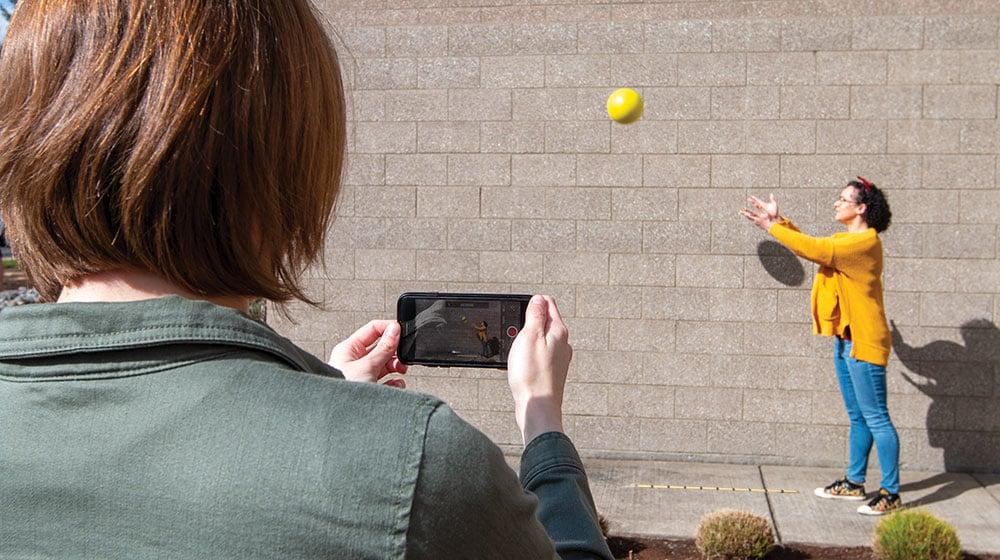
This activity introduces students to using video analysis to connect physical events to plotted data. Students use Vernier Video Analysis to track the movement of a tossed ball, manually plotting its trajectory. As students analyze the video, data tables populate, and graph points are plotted in real time.
This activity is a great way to introduce physics and human physiology students to video analysis as a tool and get them more comfortable working with graphs representing motion concepts.
Tips and Best Practices for Engaging Students in Data Collection
- Practice First: Familiarize yourself with the technology to ensure everything works smoothly and troubleshoot any issues before introducing it to students.
- Start Together: Start with a group activity to demonstrate the process, then quickly transition to letting students experiment, question, plan, and execute on their own.
- Use Meter Mode: Introduce students to the sensor and software by using meter mode to show them the basic real-time data collection process.
- Make Physical Connections: Use sensors that measure observable phenomena, like temperature, to help students make tangible connections to the data they are collecting.
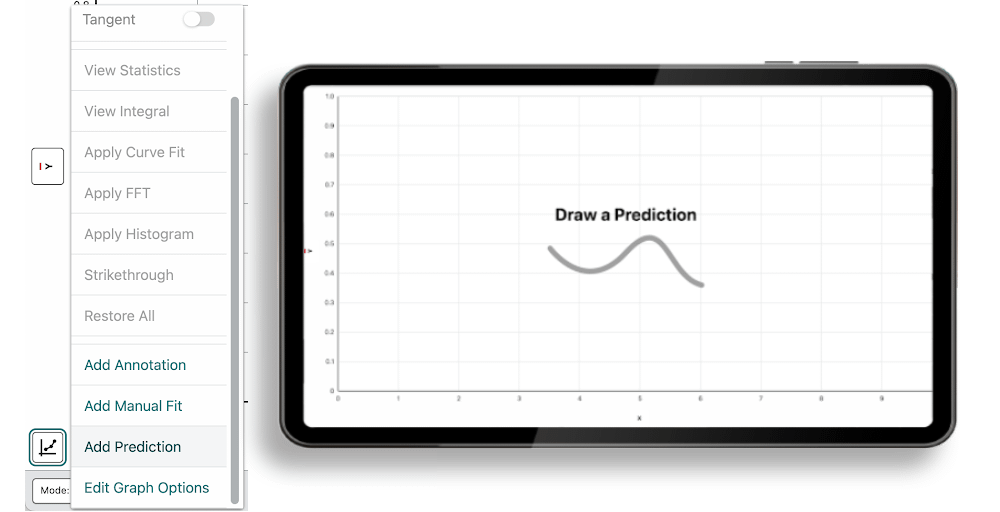
- Encourage Predictions: Have students make predictions before collecting data. Talk about it as a group, and use the “Add Prediction” tool in Graphical Analysis to test and visualize predictions.
Data Visualization and Graph Literacy: Why These Skills Are Important
In today’s information-rich world, the ability to understand and work with data is more essential for students than ever. Data literacy helps students make sense of the vast amounts of information they encounter daily—whether they’re evaluating the quality of a lab partner’s data or deciding if the content of an article they read on social media is reliable or not.
Helping students build stronger skills in analyzing and interpreting data, as well as developing explanations and engaging in arguments from evidence, is crucial not only for scientific inquiry and STEM careers but also for navigating everyday life as STEM-literate citizens.
Questions about getting started with Vernier data-collection technology? We’re here to help! Reach out to our team at support@vernier.com or call 888-837-6437. You can also use the real-time chat feature on our website!
Share this Article

Sign up for our newsletter
Stay in the loop! Beyond Measure delivers monthly updates on the latest news, ideas, and STEM resources from Vernier.

