Sharing ideas and inspiration for engagement, inclusion, and excellence in STEM
Vernier offers more than 1,000 experiments in biology, chemistry, engineering/robotics, and physics that can help you inspire students and integrate data-collection technology into your STEM classes. We will be featuring at least one of our experiments in each edition of The Caliper.
Note: All three of this month’s featured K–12 experiments are available in our Vernier Graphical Analysis™ Pro app. To support science educators during this unprecedented time, we are extending the free trial period for Graphical Analysis Pro through June 2022.
Biology
“Monitoring EKG”
In this experiment, students use the Go Direct® EKG Sensor or EKG Sensor to
- Record their heart’s electrical activity
- Determine the time interval between EKG events
- Calculate heart rate based on their EKG recording
Chemistry
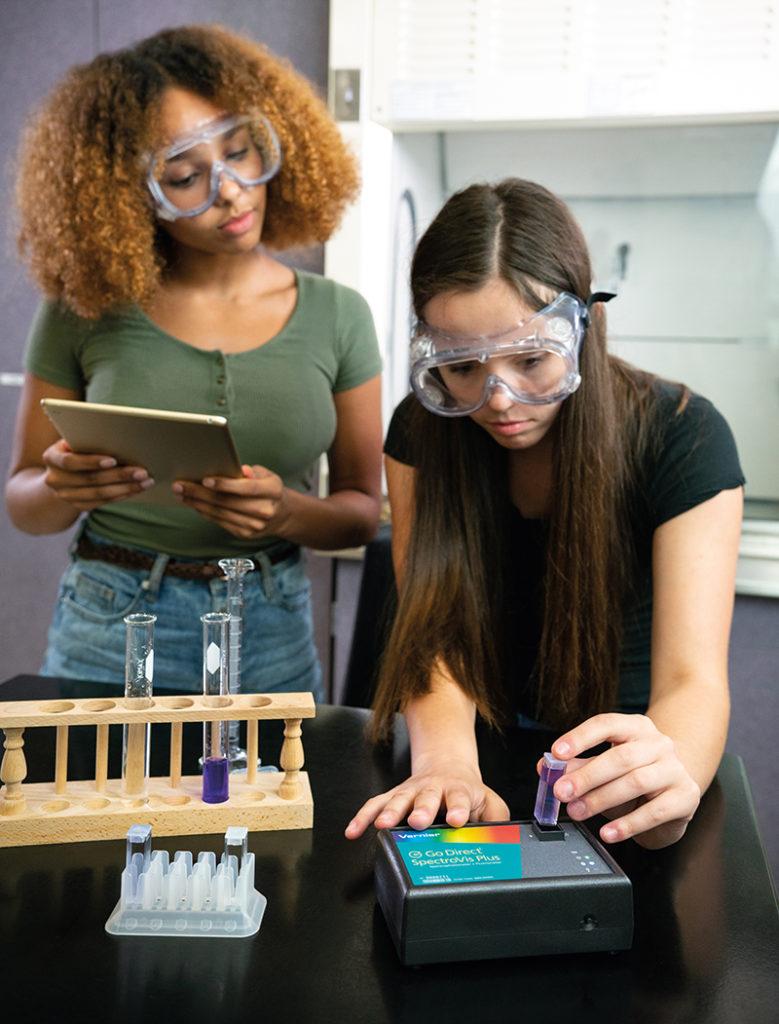
“Rate Law Determination of the Crystal Violet Reaction”
In this experiment, students use the Go Direct Colorimeter, Go Direct SpectroVis® Plus Spectrophotometer, Colorimeter, or Go Direct Visible Spectrophotometer to
- Observe the reaction between crystal violet and sodium hydroxide
- Monitor the absorbance of the crystal violet solution with time
- Graph absorbance vs. time, ln absorbance vs. time, and 1/absorbance vs. time
- Determine the order of the reaction
- Determine the rate constant, k, and the half-life for this reaction
Physics
“Speed of Sound”
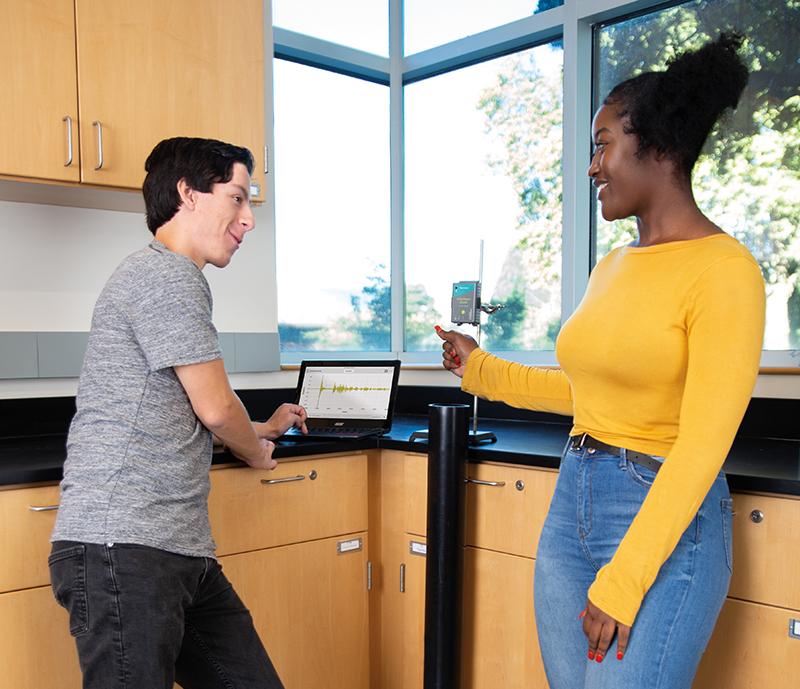
In this experiment, students use the Go Direct Sound Sensor and Go Direct Temperature Probe (or the Microphone and Stainless Steel Temperature Probe) to
- Measure how long it takes sound to travel down and back in a long tube
- Determine the speed of sound
- Compare the speed of sound in air to the accepted value
Get Graphical Analysis Pro today to access these three experiments for free!
Share this Article

Sign up for our newsletter
Stay in the loop! Beyond Measure delivers monthly updates on the latest news, ideas, and STEM resources from Vernier.


