Sharing ideas and inspiration for engagement, inclusion, and excellence in STEM

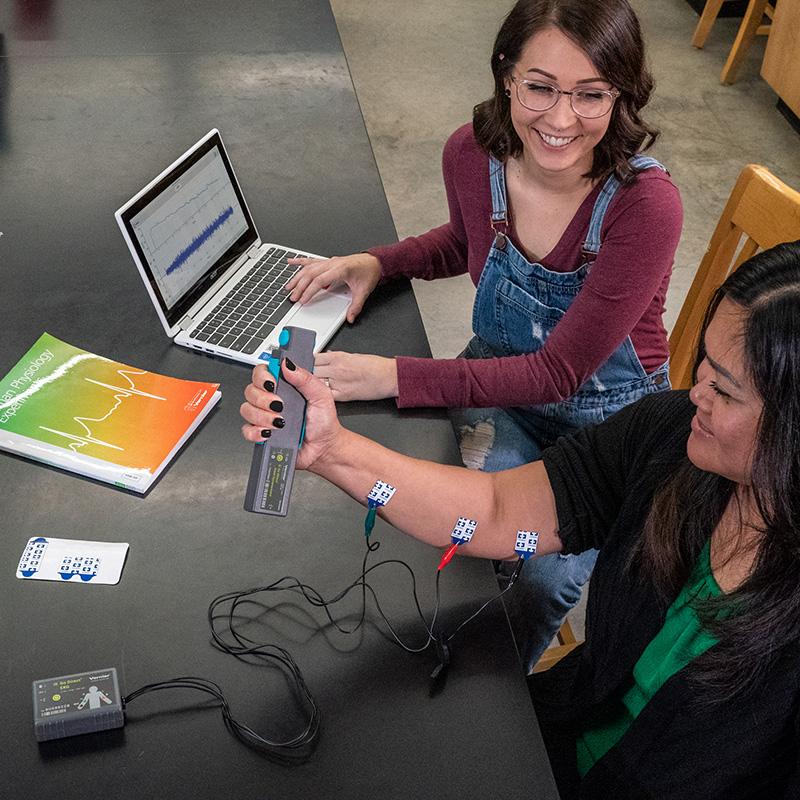
Many teachers are interested in using our EKG sensors to record an electromyogram (EMG), the electrical activity produced from muscle contractions. Recording an EMG is straightforward, but there are multiple ways that an EMG can be analyzed. The most robust technique is to measure the integral of the rectified EMG signal, which can easily be done using the Go Direct EKG Sensor.
A normal EMG has both positive and negative deflections. A rectified EMG uses a function that makes all of the EMG deflections positive—the larger the integral, the larger the muscle contraction. In the past, we have offered special Logger Pro and LabQuest files that provide the proper filtering and calculated column support to record and analyze rectified EMGs. But, the Go Direct EKG Sensor makes recording rectified EMGs much simpler. No special files or filter settings are required—just change the channel to EMG Rectified and start collecting data. Then simply measure the integral of the signal in Graphical Analysis.
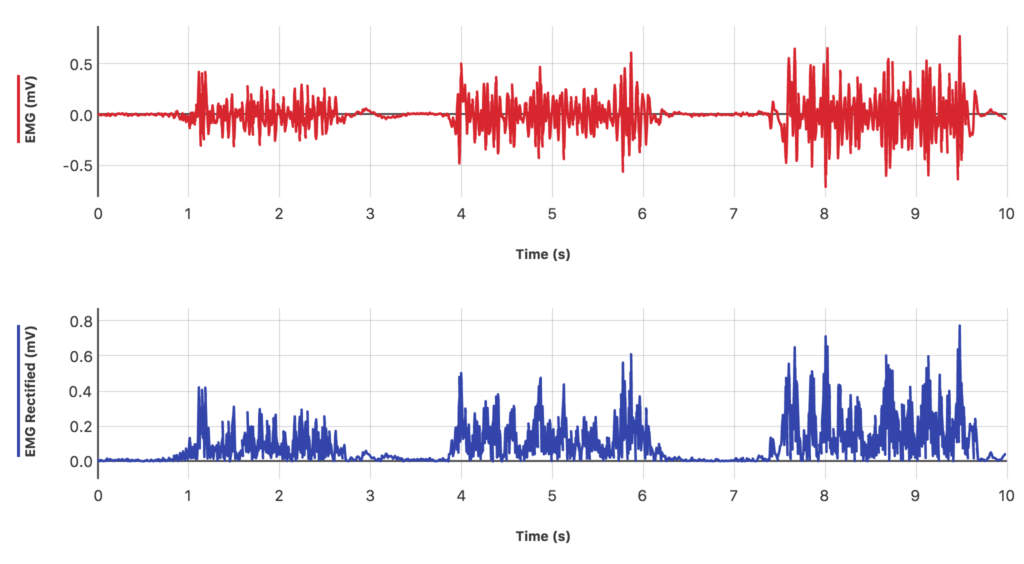
Normal and rectified EMGs recorded from the forearm
The sample graph shows an example of an EMG and rectified EMG recorded from the forearm using Go Direct EKG. A digital high-pass filter that has been optimized for recording EMGs is automatically applied to the EMG channel. The EMG Rectified channel returns the absolute value of the EMG channel, making all of the EMG deflections positive.
To analyze the rectified EMGs, simply select the region of the rectified EMG you want to analyze and use the View Integral feature in Graphical Analysis 4. You can even compare the integrals of different rectified EMGs to see which condition produced less or more muscle activity. For example, in the sample graph, the area of the rectified EMG increases with each burst of activity. The first, second, and third rectified EMGs have areas of 0.181, 0.329, and 0.441 mV s.
If you have any questions about EMGs or human physiology, feel free to contact physiology@vernier.com
Share this Article

Sign up for our newsletter
Stay in the loop! Beyond Measure delivers monthly updates on the latest news, ideas, and STEM resources from Vernier.


