Sharing ideas and inspiration for engagement, inclusion, and excellence in STEM

National DNA Day is on April 25th. This is an excellent opportunity for you to discuss the importance of DNA and to introduce the topic of gene expression in your class. As a former instructor, I found that there were very few lab activities that investigated gene expression. Most DNA activities were classic DNA precipitation or biotechnology cloning activities. While these activities are great for learning about DNA and biotechnology, one of the key concepts that I wanted my students to understand was gene expression. To this end, I worked with Bio-Rad Laboratories and my friend Dr. Roy Ventullo, a college professor and microbiologist, to develop a unique way to look at gene expression using fluorescence with our SpectroVis® Plus Spectrophotometer.
Colorimetric gene expression activities can be problematic
Gene expression is an incredibly important concept in biology. Genes can be turned on and off and are regulated in different ways and at different times in development. When I was teaching introductory biology at Wartburg College, we did a gene expression activity with E. coli in which cells were induced to produce the enzyme beta-galactosidase by exposing them to galactose. We then tested for beta-galactosidase by using ONPG (o-nitrophenyl-ß-d-galactopyranoside) as a substrate. ONPG is cleaved by beta-galactosidase and produces ο-nitrophenol. This product can be tracked colorimetrically at 420 nm using a colorimeter or spectrometer, but this method can be problematic for a number of reasons:
- The cells have to be made permeable so ONPG can react with the enzyme. This requires using SDS (sodium dodecyl sulphate) or organic solvents such as toluene to disrupt the cell membrane.
- Glass cuvettes must be used, and the reagents can still interfere with optical density measurements that need to be taken to account for cell growth. These limitations are discussed in this Analytical Biochemistry article.
- In addition, most visible spectrometers can have issues with assays that require the use of violet and blue wavelengths (400–440 nm). This can be alleviated by using an LED-boosted array spectrometer, such as the Go Direct® SpectroVis® Plus Spectrophotometer.
Gene expression using the pGLO plasmid and fluorescence spectroscopy
Though we could get the gene expression protocol using ONPG to work, it was still problematic for the student laboratory for all the reasons described above. Dr. Ventullo, who was the microbiologist at Wartburg College at the time, was able to come up with something simpler. Working with a series of students, Dr. Ventullo came up with the novel idea of tracking gene expression in E. coli using the fluorescent capabilities of the Vernier SpectroVis® Plus Spectrophotometer. His idea was simple but elegant. He used cells that had the pGLO plasmid (E. coli HB101 pGLO+), which contains a gene for GFPuv with an arabinose promoter. The cells were grown in mineral media, instead of LB broth, which can autofluoresce.
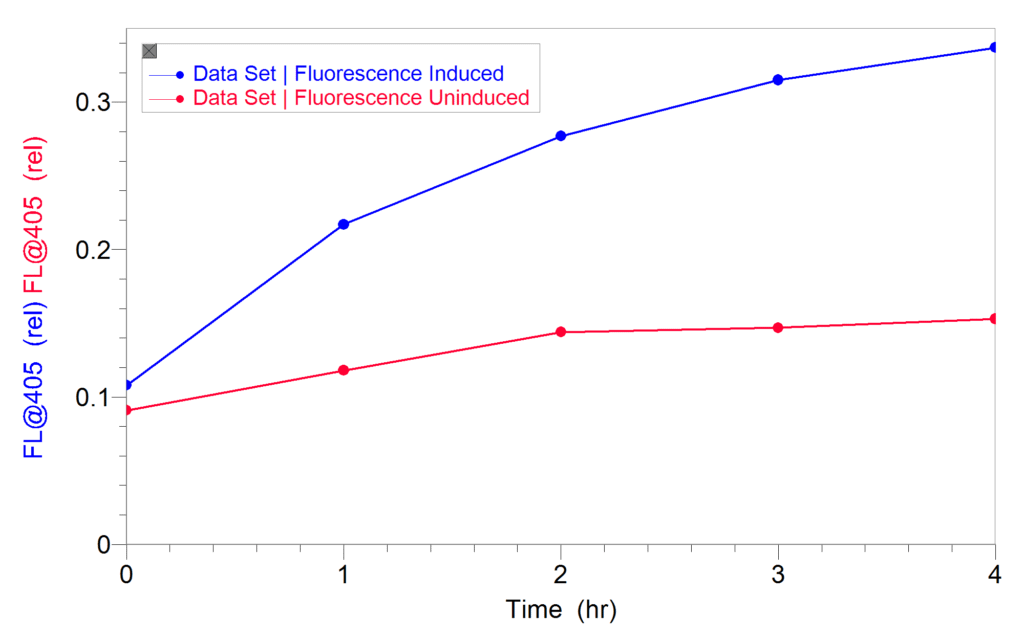
After induction, the cultures were diluted and fluorescence was measured directly in a plastic cuvette using the 405 nm LED of the SpectroVis Plus for excitation. An increase in fluorescence indicated an increase in GFPuv expression. No solvents or permeability reagents were used. Cells that were not induced were used as controls. Once he established that fluorescence could be observed in induced cultures, Dr. Ventullo then determined how long it would take to see an increase in GFPuv expression. As shown in the graph below, an increase in gene expression was observed in as little as 1–2 hours. To download the methods and results from their experiments, click here.

Share this Article

Sign up for our newsletter
Stay in the loop! Beyond Measure delivers monthly updates on the latest news, ideas, and STEM resources from Vernier.


